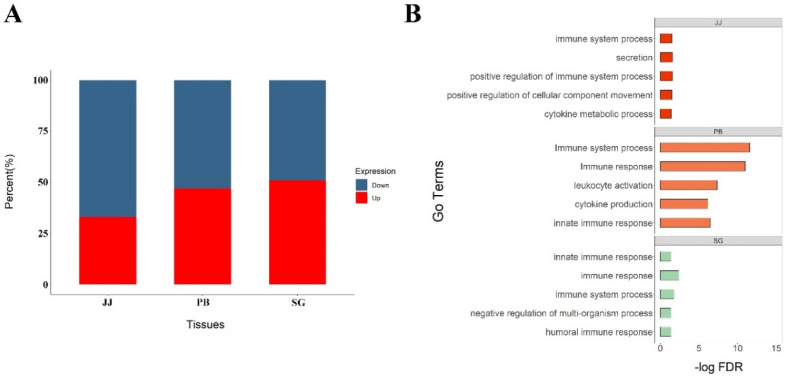
Figure 1.
Results of differential expressed analysis. (A) The percentage of up–expressed and down–expressed genes of three tissues in infected cows, red parts mean the percent of up–expressed genes, and blue parts mean down–expressed genes; (B) Pathway enrichment of differential expressed genes in different tissues.

