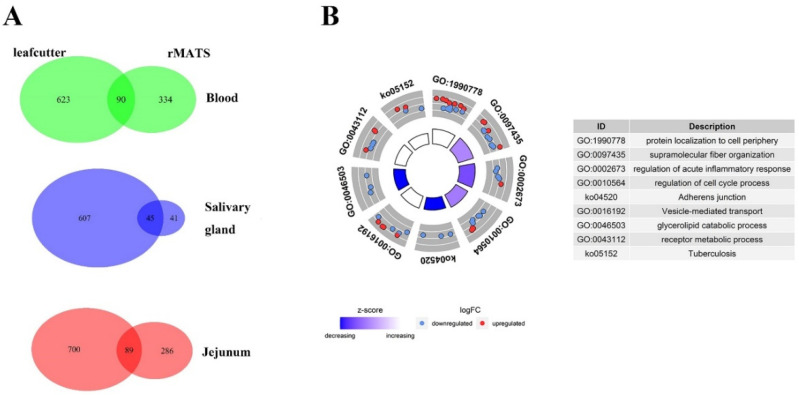
Figure 2.
Results of screened DAS events. (A) Numbers of screened DAS events. Three Venn diagrams on the left mean numbers of DAS events detected by each software and their overlapped results in different tissues. The one on the right is the intersection of the three tissues. (B) Circle figure of pathways enriched results of genes related to screened DAS events. Log2FoldChange values used to calculate Z-score were replaced by ΔPSI values of DAS events.

