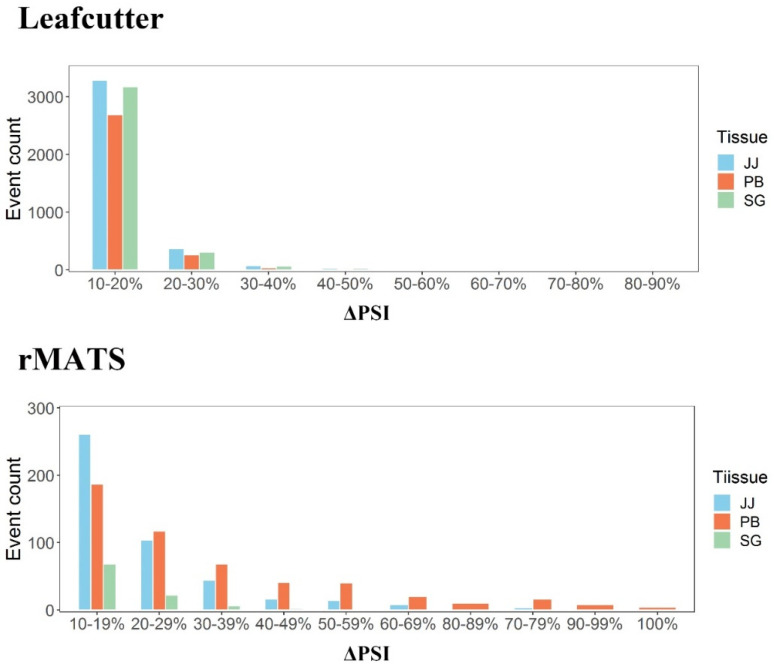
Figure 5.
The distribution of DAS events in different regions of ΔPSI value. The figure above is the distribution calculated by leafcutter, and below is that by rmats. Of them, blue parts mean DAS events in jejunum, red parts mean that in peripheral blood and green parts mean that in salivary gland.

