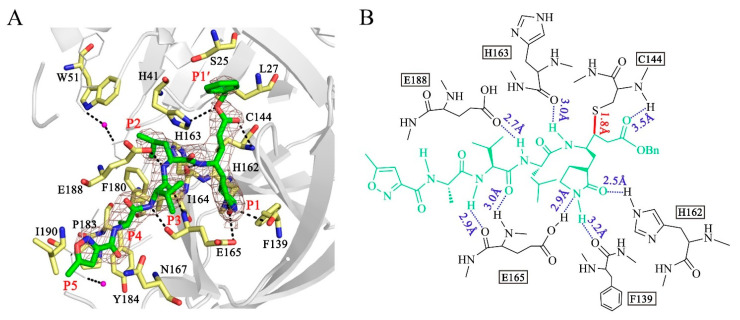
Figure 3.
Structure of the interaction between N3 and PDCoV Mpro. (A) Stereoview of N3 bound to the substrate-binding pocket of PDCoV Mpro. N3 is colored green and shown with a simulated annealing 2mFo-DFc omit map contoured at 1.0 σ. The residues at the substrate-binding pocket that contribute to the interaction between N3 and PDCoV Mpro are shown in yellow. Waters are shown in magenta. The P1′, P1, P2, P3, P4 and P5 sites are labeled. (B) Detailed interactions between PDCoV Mpro and N3. N3 is shown in green. Hydrogen bonds are shown as blue dashed lines. The covalent bond formed by N3 and the Sγ atom of Cys-144 is shown as a solid red line.

