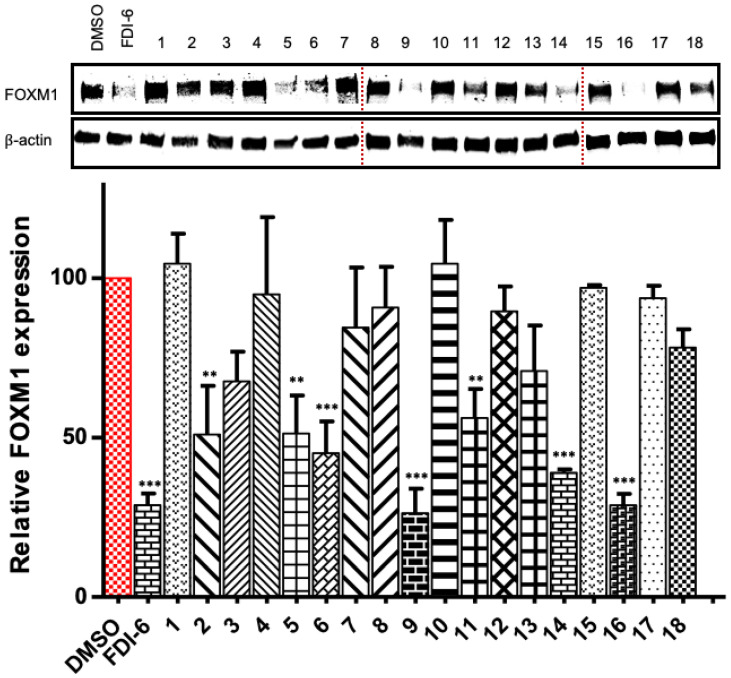
Figure 4.
Western blot analysis of FOXM1 protein levels, which were decreased by the test compounds (40 µM; 24 h; MDA-MB-231 cell line). The average values in all experiments were calculated after three independent experiments (n = 3) and are expressed as means ± SEMs; p values were calculated by one way ANOVA (** = p ≤ 0.01; *** = p ≤ 0.001).

