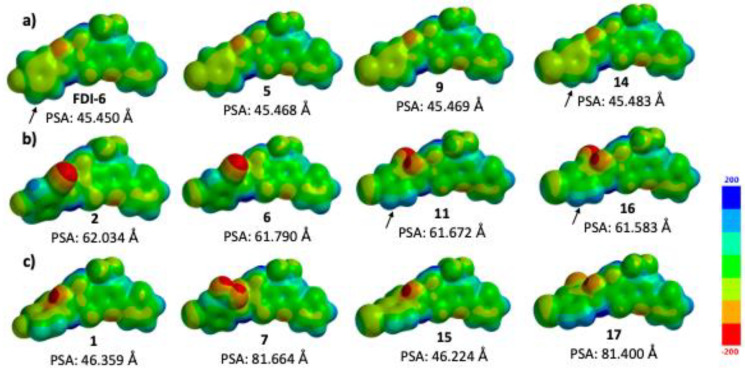
Figure 8.
Polar surface area and MEP maps superimposed onto the total electron density at a value of 0.002 e−/au3, for (a) FDI-6, 5, 9, and 14; (b) 2, 6, 11, and 16; and (c) 1, 7, 15, and 17. Blue, red, and green colors show positive, negative, and neutral MEP regions, respectively. The black arrows indicate those blue regions (MEP positive values) in the aromatic protons, adjacent to the amide proton.

