
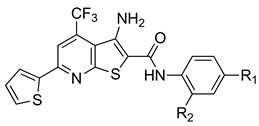
Table 2.
Docking scores calculated for the FDI derivatives during the MOE docking protocol.
| |||
|---|---|---|---|
| Compound | S (kcal/mol) a | R1 | R2 |
| FDI-6 | −5.3383 | -F | -H |
| 1 | −5.6402 | -F | -CH3 |
| 2 | −5.4899 | -F | -CN |
| 3 | −5.9180 | -F | -NO2 |
| 4 | −5.4391 | -F | -CF3 |
| 5 | −5.5565 | -Cl | -H |
| 6 | −7.2807 | -Cl | -CN |
| 7 | −6.1224 | -Cl | -NO2 |
| 8 | −5.5823 | -Cl | -CF3 |
| 9 | −5.6117 | -Br | -H |
| 10 | −5.8423 | -Br | -CH3 |
| 11 | −5.9348 | -Br | -CN |
| 12 | −6.1845 | -Br | -NO2 |
| 13 | −5.7709 | -Br | -CF3 |
| 14 | −5.6386 | -I | -H |
| 15 | −5.5661 | -I | -CH3 |
| 16 | −5.8317 | -I | -CN |
| 17 | −5.7237 | -I | -NO2 |
| 18 | −5.7932 | -I | -CF3 |
a S corresponds to the score of the last stage, in this case, calculated under the Generalized-Born Volume Integral/Weighted Surface area scoring function (GBVI/WSA dG) in kcal/mol.