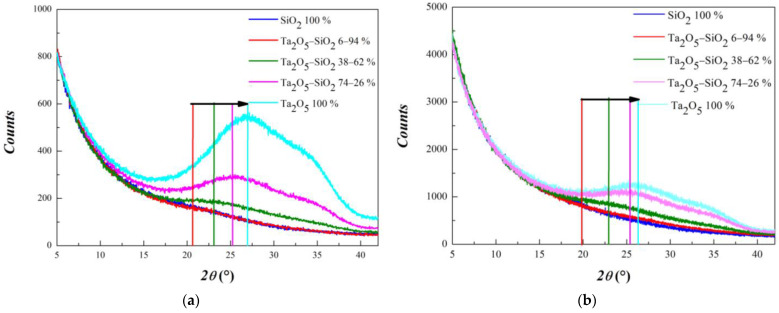
Figure 2.
GIXRD curves obtained for Ta2O5/SiO2 mixed layers with different volumetric composition in the angular range 5–42° with 0.6 (a) and 2.0 mm slit (b). The colored segments are added in order to qualitatively show the evolution of the first “structure” characterizing the diffraction profiles.

