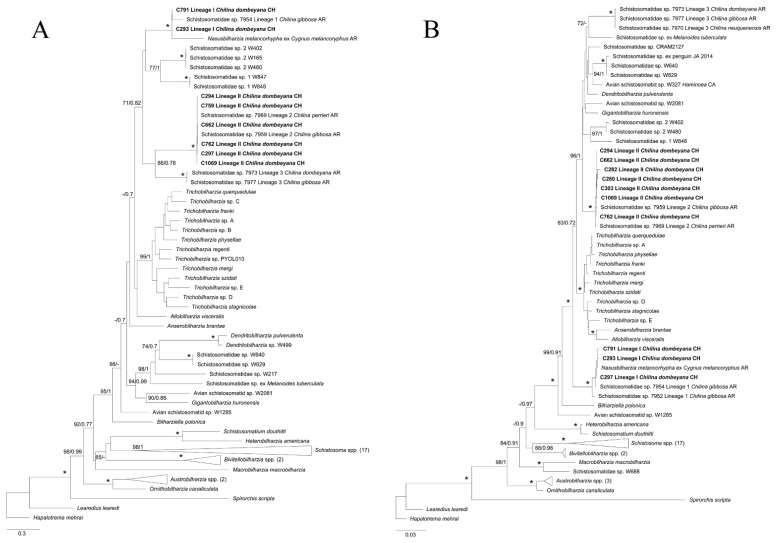
Figure 4.
Maximum likelihood (ML) phylogenetic tree for a subset of schistosomes sequences for (A) 28S and (B) COI genes. (A) This phylogeny was inferred using an alignment of 1699 bp. Calculated substitution models for ML and BI were GTR+F+G4, and M203, M198, and M200, respectively. The best models were chosen using the Bayesian Information Criterion (BIC). (B) This phylogeny was inferred using an alignment of 1188 bp. Calculated substitution models for ML and BI were as follows: TIM2+F+I+G4 (part1), GTR+F+I+G4 (part2), and TIM2+F+I+G4 (part3); M201, M138, M162, M189, M203, M134, and M193 (part1); M29, M92, M68, M71, M81, M54, and M180 (part2); and M125, M191, M193, M200, M189, M203, M166, and M64 (part3), respectively. The best models were chosen using the Bayesian Information Criterion (BIC). (A,B) Bootstrap values ≥ 70 (left) and posterior probabilities ≥ 0.7 (right) are presented at every node. An asterisk (*) indicates full support (100/1). The generated sequences in the present study are highlighted in bold. Outgroups with more than two sequences were collapsed with the number of sequences detailed between parentheses.

