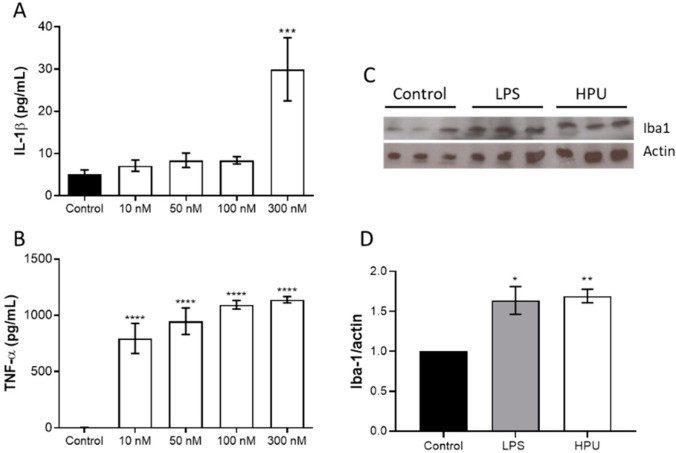
Figure 3.
Microglial activation by HPU. For detection of cytokine expression, BV-2 cells were incubated for 6 h with HPU, and cultures’ supernatants were collected for detection of IL-1β panel (A) and TNF-α panel (B) by ELISA. The data (mean ± SEM) were analyzed by one-way parametric ANOVA with a Dunnett post-test. *** p < 0.001, **** p < 0.0001 vs. control. Panels (C,D): Iba1 levels in brain homogenates of HPU-treated rats were analyzed by Western blots (C), and quantified by densitometry (D). The data (mean ± SEM) were analyzed by one-way ANOVA followed by Bonferroni post hoc test. * p < 0.05, ** p < 0.01 vs. controls. All data were normalized against the endogenous actin content.

