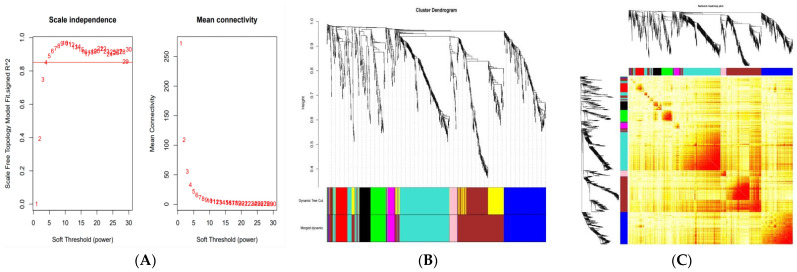
Figure 1.
(A) Clustering of samples and determination of soft thresholding power. (B) Hierarchical dendrogram of genes. Eight modules were constructed, each decorated with a different color. (C) Visualizing gene co-expression network TOM. A light color represents a low overlap, and gradually darker red indicates high overlap.

