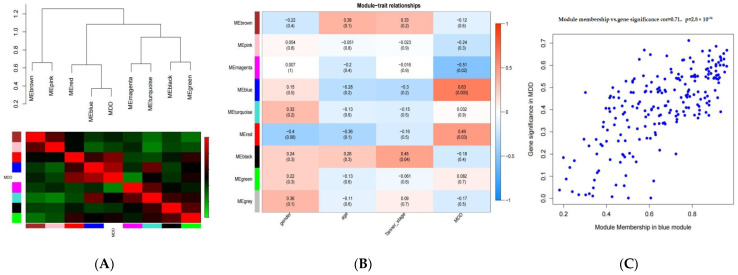
Figure 2.
(A) The eigengene adjacency heatmap. The dendrogram indicates that the blue module is highly related to MDD. (B) Correlation heatmap of modules and traits. The adjusted p-value and correlation coefficient are shown in each cell. (C) Scatterplot of Gene significance (GS) for depression VS.module membership (MM) in the blue module.

