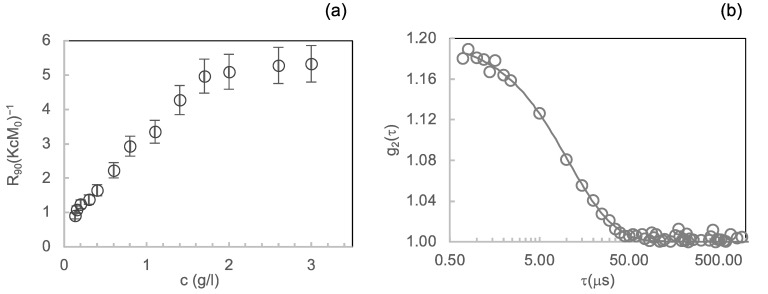
Figure 1.
Concentration dependence of insulin oligomerisation state in the refolding buffer monitored by light scattering: (a) Scattered light intensities at 90° angle from solutions of insulin protein at different concentrations expressed in terms of the Rayleigh ratio R90° normalised by (KcM0) values; (b) second-order autocorrelation functions g2 (τ) from dynamic light scattering experiment carried out on insulin at 2 mg/mL. The continuous line represents the fitting curve resulting from data analysis by the method of cumulants.

