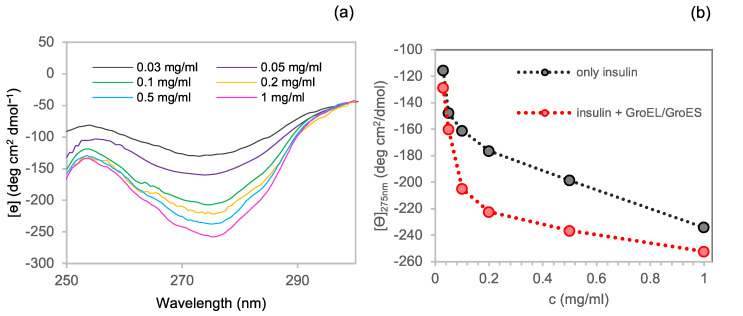
Figure 3.
Concentration dependence of insulin oligomerisation state in the presence of GroEL/GroES monitored by near-UV CD spectroscopy: (a) Near-UV CD spectra of insulin in the presence of GroEL/GroES and subtracted of the chaperonins corresponding spectra at 0.03 mg/mL (grey), 0.05 mg/mL (violet), 0.1 mg/mL (green), 0.2 mg/mL (yellow), 0.5 mg/mL (light blue) and 1 mg/mL (pink); (b) insulin mean residue ellipticity at 275 nm in the presence (red) and in the absence (black) of GroEL/GroES.

