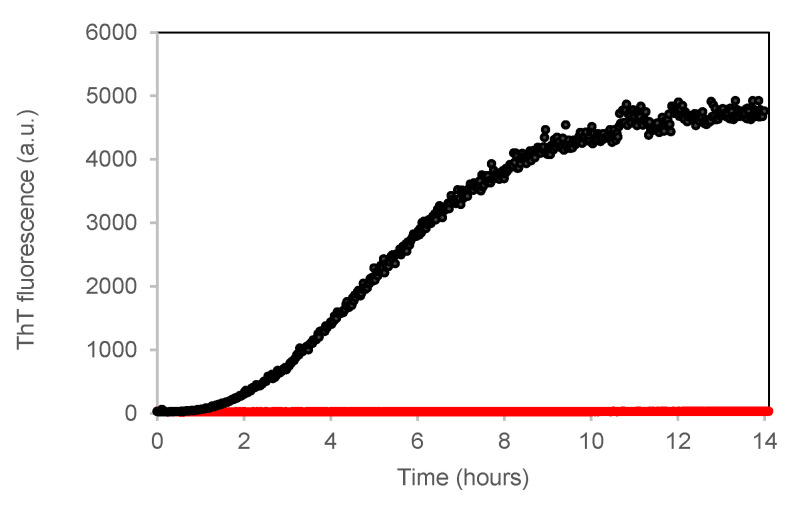
Figure 5.
ThT assay to study GroEL/GroES effect on insulin fibrillogenesis at pH 7.4. Time dependence of ThT fluorescence at 482 nm (ex 450 nm) upon incubating the dye (12 μM) with insulin at 0.1 mg/mL, 50 °C and under 200 rpm stirring in the absence (black) and the presence of GroEL/GroES (red) at a molar ratio (GroEL/GroES):insulin = (1:1):10.

