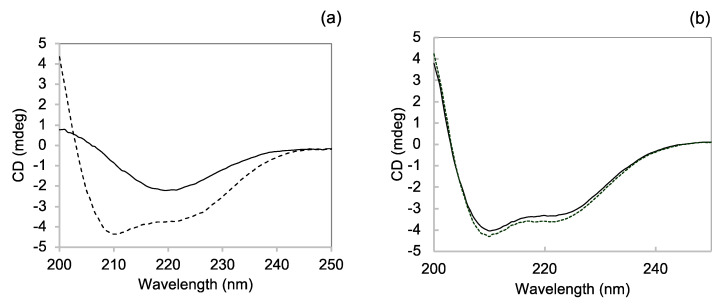
Figure 6.
Far-UV CD to assess the influence of GroEL/GroES on the insulin conformational transition accompanying amyloid formation. CD spectra of 0.1 mg/mL insulin at the beginning (dotted line) and after 14 h (continuous line) of incubation at 50 °C, under 200 rpm stirring in the absence (a) and in the presence (b) of chaperonins.

