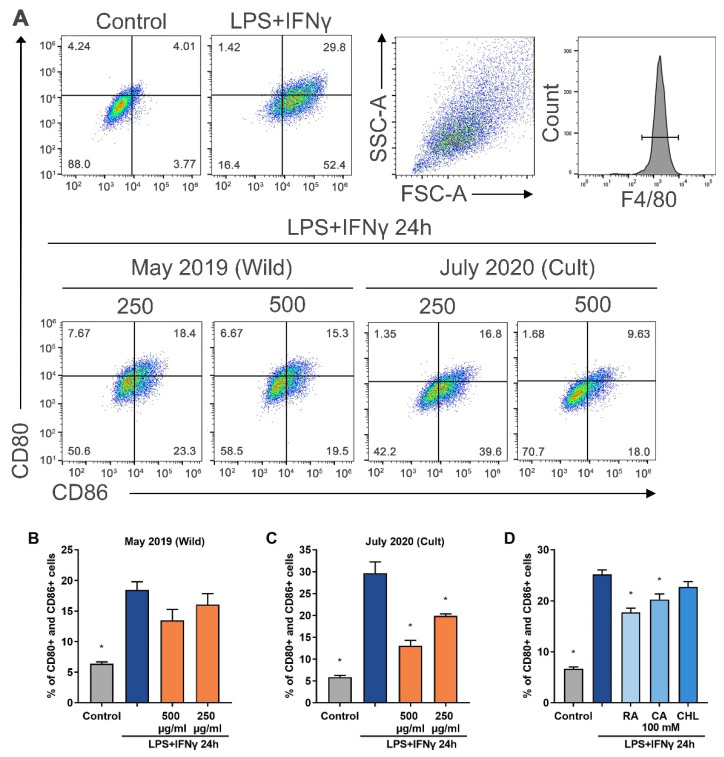
Figure 5.
Flow cytometry analysis of bone-marrow-derived macrophage (BMDM) polarization toward the M1 phenotype. (A) Upper right quadrant: F4/80-positive cells were gated for double CD80 and CD86 analysis. The dot plot representation of a total of three independent experiments with two replicates is shown at the bottom of the figure. (B,C) Expression of the proinflammatory cell surface markers CD80 and CD86 was analyzed by flow cytometry 24 h after treating BMDMs with (GH01) extracts (250 µg/mL and 500 µg/mL) or (D) rosmarinic acid, chlorogenic acid, or caffeic acid (each 100 mM) and LPS/IFN-γ. Data are represented as the mean ± SEM of three independent measurements from two parallel experiments. Differences between the measurements were tested using one-way ANOVA followed by Dunnett’s test. * Significantly different from the LPS/IFN-γ control (p < 0.05).

