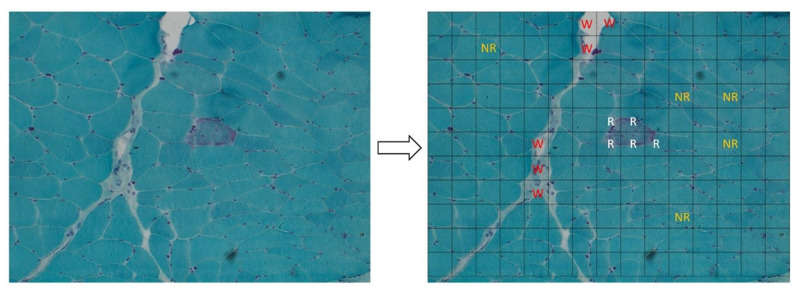
Figure 1.
Left panel: ragged red fiber (RRF), hallmark of mitochondrial disorders, in Gomori’s trichrome stain (magnification: 20×; image acquired from the muscle of patient 8). Right panel: it shows the method used to create the dataset for our analysis: each acquired image was subdivided in 165 sub-images (15 × 11). All the sub-images that contain a portion of an RRF were added to the dataset and labeled as “ragged” (R label in the figure, written in white). After that, we arbitrarily collected a similar number of sub-images that do not contain RRFs, labeling them as “not ragged” (NR label, written in orange) and some “waste” sub-images (W label, written in red). The rest of the sub-images were discarded to avoid the unbalancing of the dataset.

