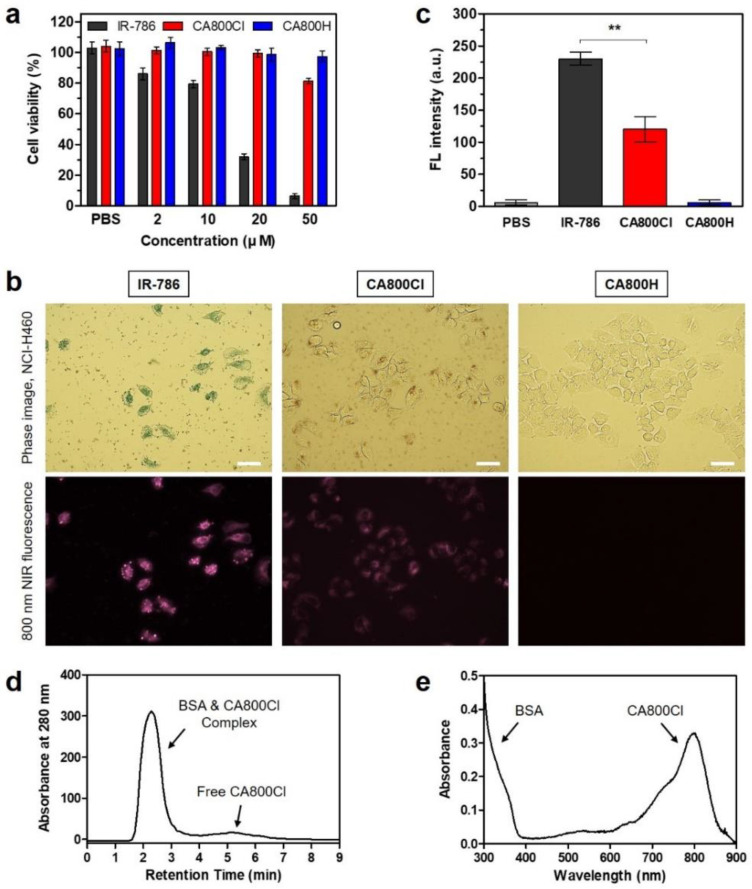
Figure 3.
(a) Cell viability assay of each NIR fluorophore using NIH/3T3 cells. Percentage cytotoxicity is determined after 24 h of treatment with various concentrations of each NIR fluorophore. (b) Live cancer cell binding and (c) relative fluorescence intensity of each NIR fluorophore in NCI-H460 cancer cells. Phase contrast and NIR fluorescence images of cell line are obtained using 10 µM of each NIR fluorophore. Data are expressed as mean ± S.D. (n = 3). ** p < 0.01. All NIR fluorescence images have identical exposure times and normalization. Scale bar = 100 μm. (d) GFC separation of a mixture of BSA and CA800Cl. The hydrodynamic diameter of BSA complex was measured at 280 nm using an absorbance spectrophotometer. (e) Absorption spectrum of BSA & CA800Cl complex. The sample was obtained from the first peak fraction as shown in (d).

