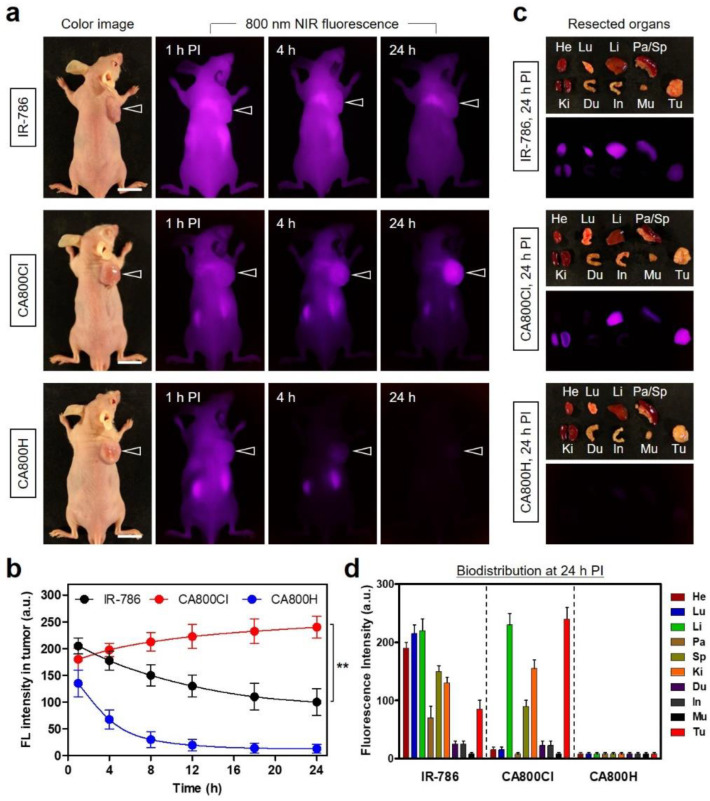
Figure 4.
In vivo NCI-H460 tumor targeting efficiency and biodistribution of NIR fluorophores. (a) NIR fluorescence imaging at 1 h, 4 h, and 24 h post-injection of IR-786, CA800Cl, and CA800H, respectively. (b) Time-dependent fluorescence intensities at the tumor sites targeted by each NIR fluorophore. (c) Resected organs and tumors imaged 24 h after injection of each NIR fluorophore. (d) Quantitative fluorescence analysis of intraoperative dissected organs 24 h post-injection of each NIR fluorophore. The tumor site is indicated by an arrowhead. Abbreviations: Du, duodenum; He, heart; In, intestine; Ki, kidneys; Li, liver; Lu, lungs; Mu, muscle; Pa, pancreas; Sp, spleen; Tu, tumor; and PI, post-injection. Scale bars = 1 cm. All NIR fluorescence images have identical exposures and normalizations. Data are expressed as mean ± S.D. (n = 3). ** p < 0.01.

