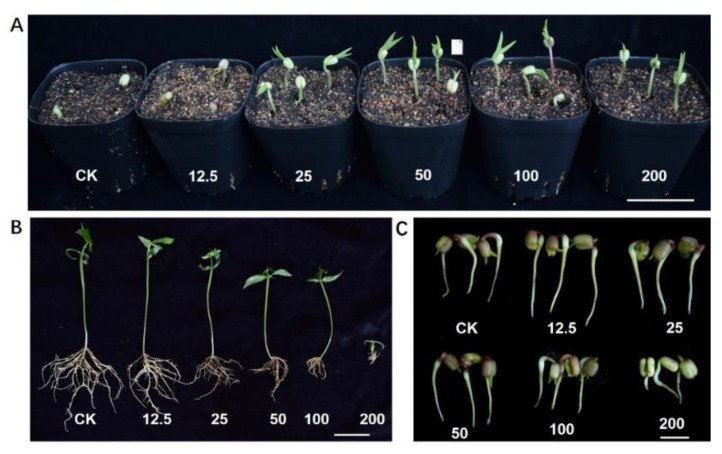
Figure 2.
Effects of GO treatment on mung bean seedlings grown in different media. (A) Representative image of 5-day-old mung beans planted in soil. Scale bar = 5 cm. (B) Representative image of 10-day-old mung beans planted in solid MS medium. Scale bar = 5 cm. (C) Representative image of 3-day-old mung beans grown in water solution. Scale bar = 1 cm. Plants were treated with GO to a final concentration of 0, 12.5, 25, 50, 100, or 200 mg/L.

