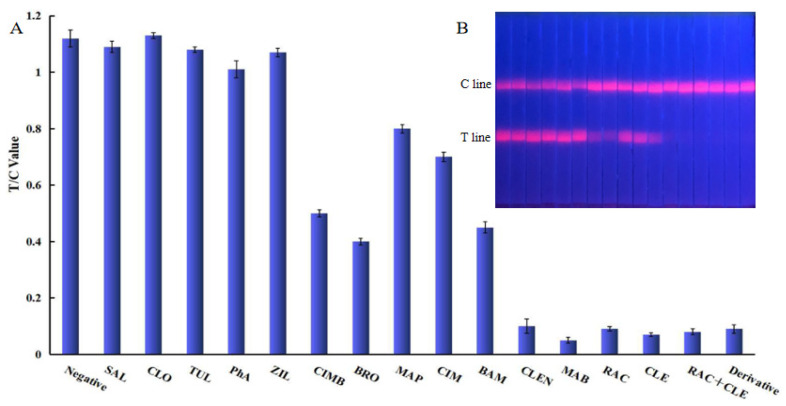
Figure 3.
Specific analysis of EuNP-FLFIA. (A) Specific evaluation results (from left to right are negative: SAL, CLO, TUL, PhA, ZIL, CIMB, BRO, MAP, CIM, BAM, CLEN, MAB, RAC, CLE, RAC+CLE, and Derivative). (B) T/C value data analysis showing the extent of the cross-reactivity of CLE-RAC with other β2-agonists.

