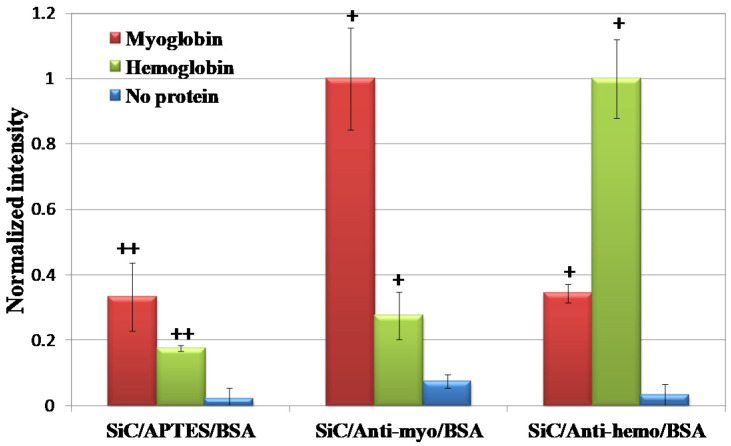
Figure 8.
Normalized fluorescent intensity of Alexa-Fluor 488-labeled myoglobin and hemoglobin bound to APTES (left), anti-myoglobin (center), and anti-hemoglobin immobilized on SiC (right) with their respective controls. The results are expressed as the sample distribution of the mean () and standard error of the mean (σM), and normalized to the positive control experiments in each test. + denotes p-values < 0.05 with respect to the antibody immobilized control and ++ denotes p-values < 0.05 with respect to the surface after APTES modification [19].

