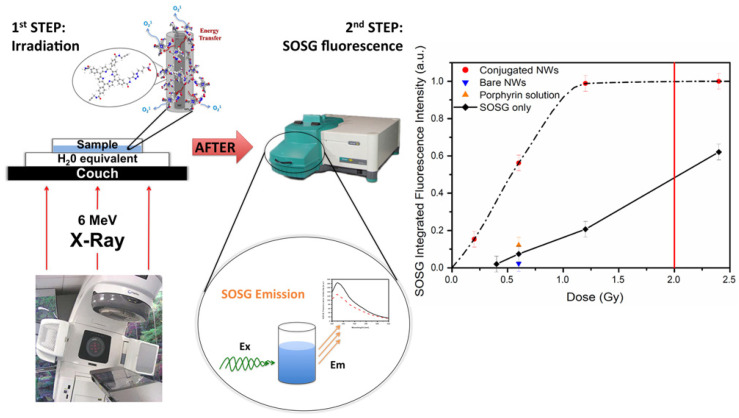
Figure 11.
1O2 production excited by X-rays in a radiation therapy setup. Sketch of the experimental steps: a dish containing the sample solution is put on the couch and irradiated from the bottom, and then it is transferred to a spectrophotometer to acquire the fluorescence spectrum of the SOSG marker. The plot reports the measured integrated fluorescence intensity, proportional to 1O2 generated, as a function of the radiation dose. The experimental points are obtained from a SOSG kit in water, with H2TPACPP-functionalized NWs (red circles) or without NWs (black diamonds). The orange triangle at 0.6 Gy is the experimental point obtained from the SOSG kit in a water solution of mere porphyrin, while the blue triangle is obtained from the SOSG kit in a water suspension of NWs as grown. The usual dose for clinical treatment (2 Gy) is indicated by the red vertical line [2].

