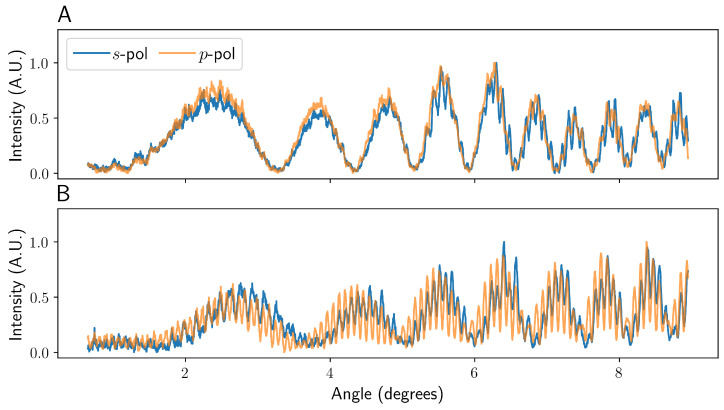
Figure 5.
A figure showing the experimental intensity patterns seen for a capillary both higher (A) and lower (B) than the limit. The data were taken at ∼ horizontally and ∼ vertically from the capillary, with a camera width of . The data were longitudinally averaged to reduce high-frequency noise and produce a more representative fringe pattern [13]. The data have been normalised between 0 and 1 to aid comparison.

