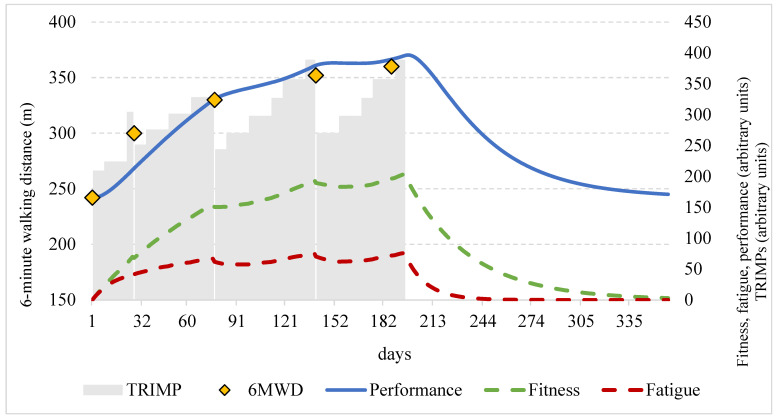
Figure 1.
Description of the impulse–response model of a sample subject included in the study considering the 6MWD. Orange diamonds represent measured performance; blue line describes the predicted performance by IR model by subtracting positive training effects (fitness: green dashed line) to negative training effects (fatigue: red dashed line). Daily training impulses (TRIMPs) are also reported as grey columns. All variables represented as functions of time (days) in the horizontal axis.

