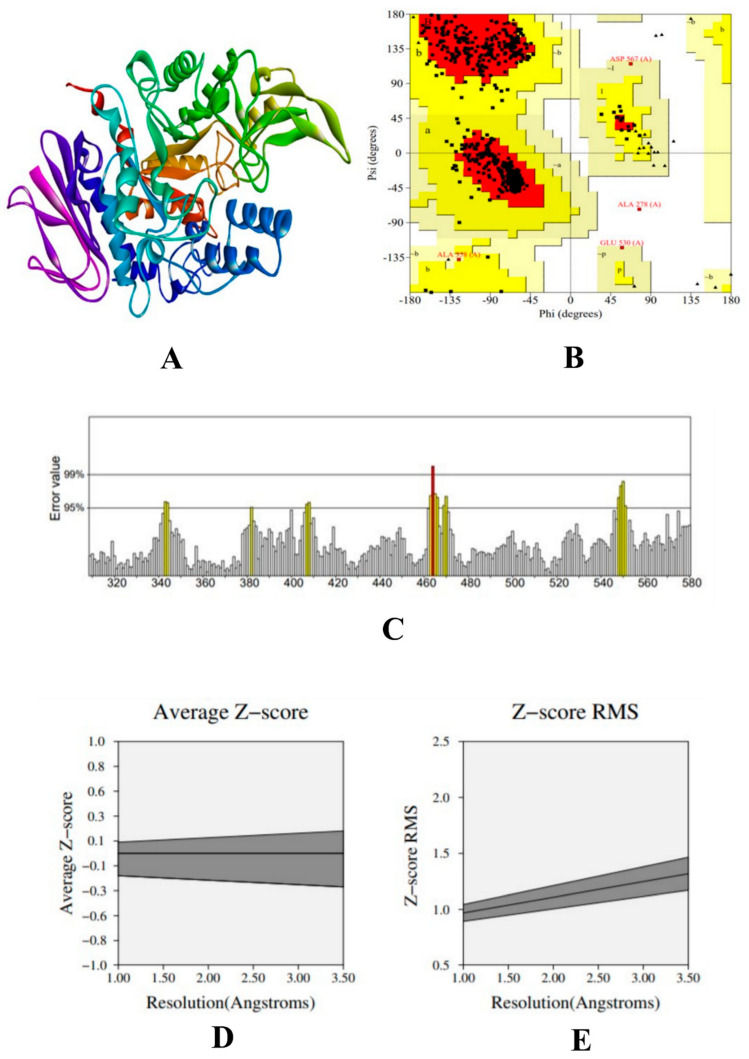
Figure 4.
(A) 3D structure of homology-built model of α-glucosidase, (B) Ramachandran plot of the α-glucosidase model showing the residues present in the favoured region, (C) ERRAT result of the α-glucosidase model showing the overall stability and reliability, where the red line depicts the rejected part of the protein, (D) Z-score result the α-glucosidase model showing the average Z-score, and (E) Z-score RMS of the α-glucosidase model.

