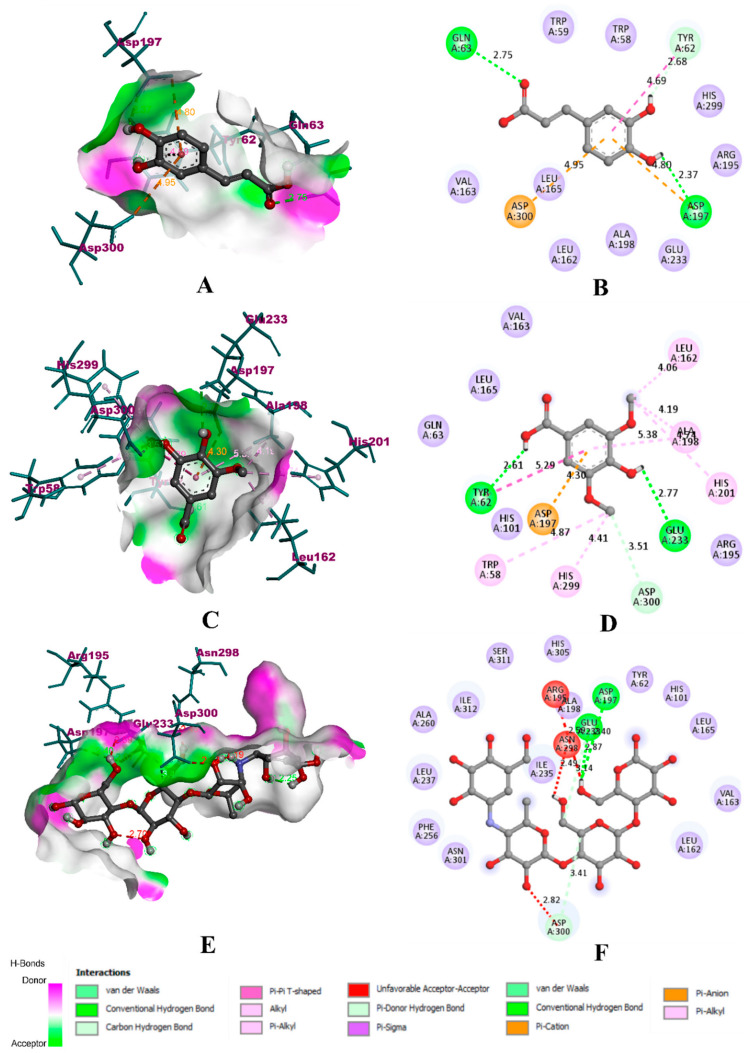
Figure 6.
Visualization of docking simulation of experimental compounds with α-amylase. (A,B) Interaction of caffeic acid visualized in 3D and 2D, (C,D) Interaction of syringic acid visualized in 3D and 2D, (E,F) Interaction of acarbose visualized in 3D and 2D, respectively (coloured: bound residues, violet: surrounding residues).

