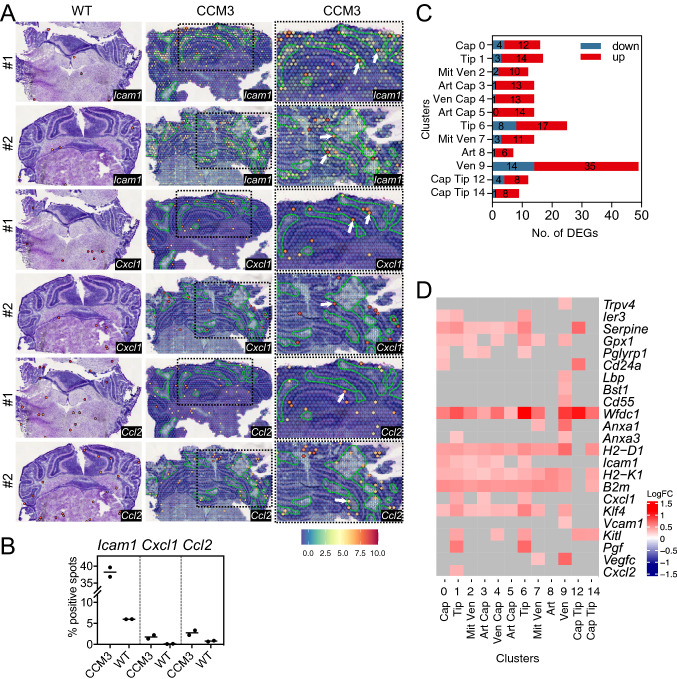
Fig. 2.
Spatial transcriptomics datashowed an increased expression of genes that encode proteins with chemoattractant and adhesion functions. By scRNA sequencing analysis venous/venous capillary endothelial cells showed the highest number of upregulated and downregulated CCM-associated immune genes. A Gene expression levels of Icam1, Cxcl1 and Ccl2 measured in Visium spatial transcriptomics data of Ccm3iECKO mice (CCM3) in acute CCM. All sequenced dots are shown, colour coded for expression: blue, low; red, high. Negative spot outlines are shown without fill colour for visualisation of underlying haematoxylin and eosin staining (dark, light violet). Both complete sections and magnified boxed areas are shown. Green lines, outline of CCM lesions. Arrows, examples of spots expressing the indicated genes that colocalised with, or were in close proximity to, the periphery of the cavernomas. B Plots showing proportions (%) of spots in the cerebellum expressing Icam1, Cxcl1 and Ccl2 measured in Visium spatial transcriptomics data, as shown in A (n = 2 per group). C Numbers of CCM-associated immune genes (Fig. 1C, see method) by scRNA sequencing analysis (scRNA-seq) that were up-(red) or down-(blue) regulated (padj < 0.05) in each endothelial cell subtype of Ccm3iECKO mice in acute CCM [21]. D Heatmap showing log fold expression changes of immune response associated genes identified from bulk RNA-seq (Fig. 1D, gene annotation column) in each cell type of scRNA-seq data [21]. Only immune response genes that differed in gene expression between Ccm3iECKO and wild-type (WT) control mice in at least one endothelial cell subtype are shown here. C–D The identify of each endothelial cell subtype cluster (C) is as follows: Cap capillary (C0), Tip tip cells (C1, C6), Mit Ven mitotic/venous capillary (C2, C7), Art Cap arterial capillary (C3, C5), Ven Cap venous capillary (C4), Art arterial (C8), Ven venous/venous capillary (C9), Cap Tip capillary/tip cells (C12, C14)

