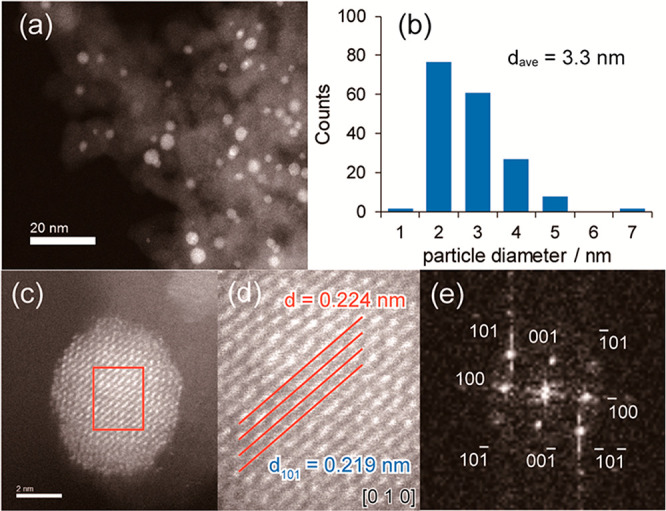
Figure 10.

(a) TEM image of PdZn@Pb0.25 TMNPs. (b) Size distribution of the TMNPs. (c) HRTEM image of a single nanoparticle. (d) Further magnification of the region denoted by the red square in (c), highlighting the lattice fringes on the (010) plane. (e) Fast Fourier transform of the single nanoparticle. Adapted from ref (165). Copyright 2019 American Chemical Society.
