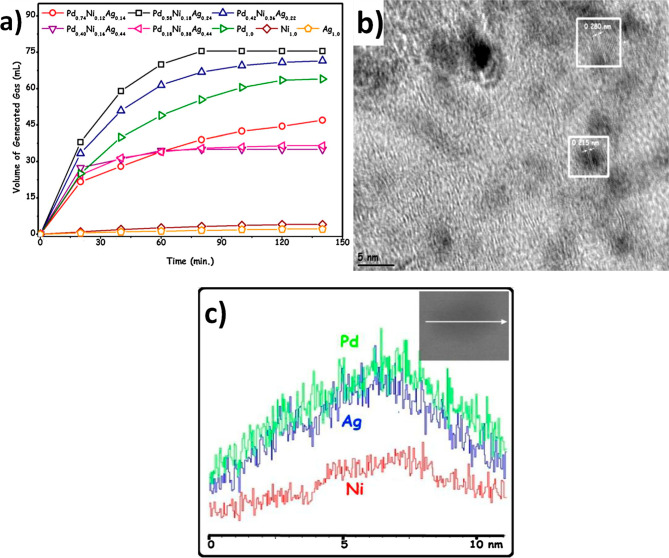
Figure 15.
(a) Volumes of H2 gas generated as functions of reaction time from the dehydrogenation of FA over MMNP (Pd/C, Ag/C, Ni/C), BMNP (Pd0.55 Ni0.45/C, Pd0.52 Ag0.48/C, Ni0.58Ag0.42/C), and TMNP (Pd0.74Ni0.12Ag0.14/C, Pd 0.42Ni0.36Ag0.22/C, Pd0.40Ni0.16Ag0.44/C, Pd0.18Ni0.38Ag0.44/C) catalysts. Reaction conditions: [metal] = 2.85 mM and [FA] = [SF] = 0.175 M in 10.0 mL of aqueous solution at 323 K. (b) HRTEM images of PdNiAg/C. (c) Elemental distribution of components in the PdNiAg NPs obtained by line-scan analysis using STEM-EDX along the white arrow in the HAADF-STEM image of PdNiAg/C given in the inset. Adapted with permission from ref (27). Copyright 2014 Elsevier.

