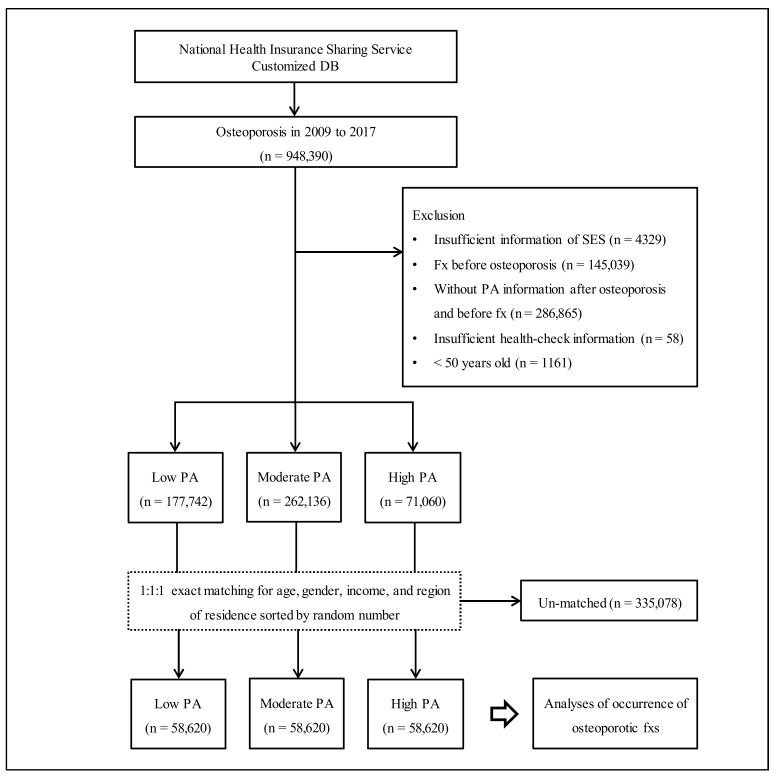
Figure 1.
The participant selection flow. Out of a total of 948,390 participants with osteoporosis, ‘high PA’ (n = 58,620), ‘moderate PA’ (n = 58,620), and ‘low PA’ (n = 58,620) were matched by a ratio of 1:1:1 by age, gender, income, and region of residence. Abbreviation: fxs, fractures; PA, physical activity; SES, socioeconomic status.

