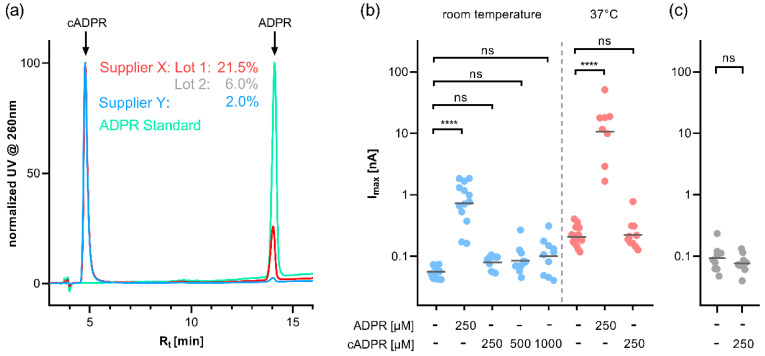
Figure 1.
(a) HPLC analysis of cADPR from different suppliers (red, grey and blue). Due to the varying amount of cADPR in the preparations, the chromatograms have been normalised to the cADPR peak to illustrate the different fractions of ADPR in the preparations. The ADPR standard (green) is shown for comparison. (b) cADPR does not activate human TRPM2 at either room temperature or at 37 °C. HEK293 cells with stable expression of human TRPM2 were infused via the patch pipette with an intracellular solution buffered to a Ca2+ of 200 nM with EGTA and containing either 250 µM ADPR or 250 µM cADPR. Cells were kept at either room temperature (blue) or 37 °C (red) by continuous perfusion with bath solution. The bath solution contained NMDG instead of Na+. (See Supplementary Material Figure S1 for representative time courses and a schematic representation of the voltage ramp) (c) cADPR does not activate human TRPM2 in a bath solution with NaCl. At room temperature, TRPM2-expressing HEK293 cells were infused with an intracellular solution that contained either no nucleotide or 250 µM cADPR. Max currents at +15 mV from repetitive voltage ramps are shown on a log scale. Log transformed data were tested against the respective control by one-way ANOVA followed by post hoc t test with Bonferroni correction (b) or two-tailed Student’s t test (c), the mean of the log-transformed data is indicated by a horizontal bar (**** p < 0.0001, ns not significant).

