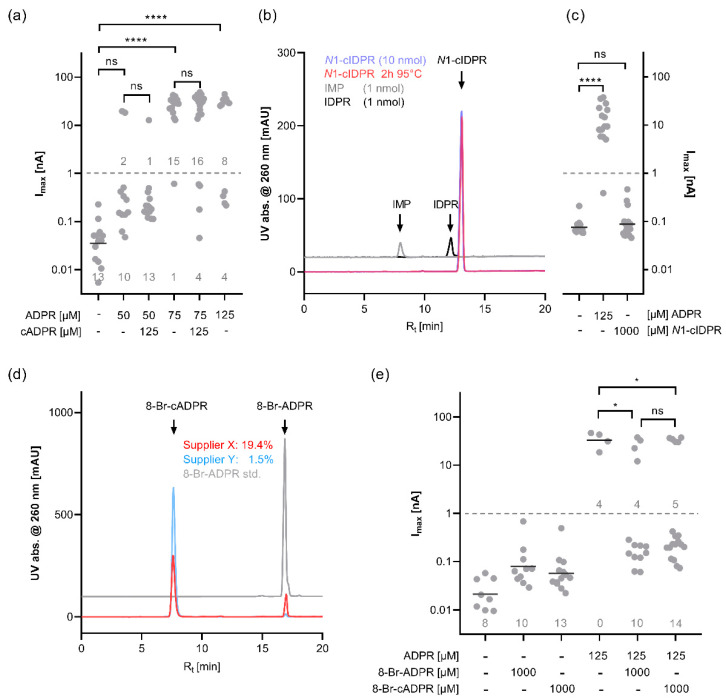
Figure 2.
(a) cADPR does not enhance the TRPM2 current at threshold concentrations of ADPR. HEK293 cells with stable expression of human TRPM2 were infused via the patch pipette with an intracellular solution with weak Ca2+ buffering (100 µM EGTA) and containing varying concentrations of ADPR with or without 125 µM cADPR. During the recording, cells were kept at room temperature. With ADPR in the pipette solution, the currents show a bimodal distribution, with some cells showing a slight increase in current compared with the control while others exhibit a current two orders of magnitude higher. Log-transformed data were tested using Kruskal–Wallis test with Dunn’s correction (**** adj. p < 0.0001, ns = not significant) (b) HPLC analysis of N1-cIDPR (blue), N1-cIDPR that has been incubated at 95 °C for 2 h (red), and standards of potential breakdown products IMP (grey) and IDPR (black). (c) The nonhydrolysable cADPR analogue N1-cIDPR does not activate human TRPM2. TRPM2-expressing HEK293 cells were infused with a pipette solution containing either no nucleotide or either ADPR or N1-cIDPR. Log-transformed data were tested using Kruskal–Wallis test with Dunn’s correction (**** adj. p <0.0001, ns = not significant) (d) HPLC analysis of 8-Br-cADPR from two different suppliers (red and blue) and an 8-Br-ADPR standard (grey). The numbers indicate the fractional peak area of the 8-Br-ADPR peak in the analysed 8-Br-cADPR. (e) 8-Br-ADPR and 8-Br-cADPR reduce the ADPR-induced current in TRPM2-expressing HEK293 cells. Cells were infused with a pipette solution that contained no nucleotide, 125 µM ADPR, 1 mM 8-Br-ADPR, 1 mM 8-Br-cADPR, or a combination thereof. For some conditions, the horizontal bar indicates the mean of the log-transformed currents. Due to the bimodal distribution, the fraction of cells responding to a current above and below 1 nA were compared using Fisher’s exact test (* p < 0.05, ns = not significant).

