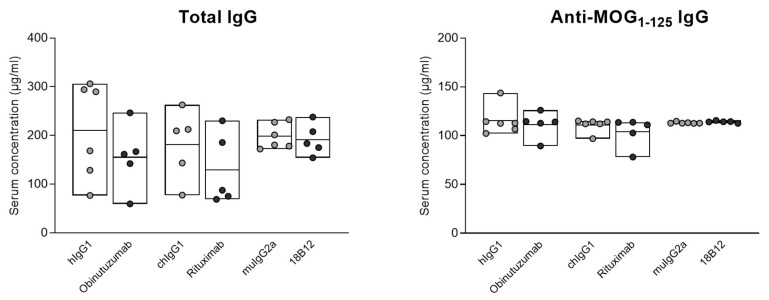
Figure 2.
Serum levels of total and anti-MOG1–125 IgG in hCD20xhIgR3 and WT B6 mice. Mice were each injected three times with 5 mg/kg anti-CD20 mAbs or the corresponding isotype controls. Serum IgG levels were determined by ELISA in 5–6 mice per group, 7 days after the last injection. Each circle represents the mean value for an individual mouse. The bars indicate the group mean value as well as minimum and maximum values. Statistical significance was evaluated by unpaired t-test. There was no statistically significant difference between any of the groups.

