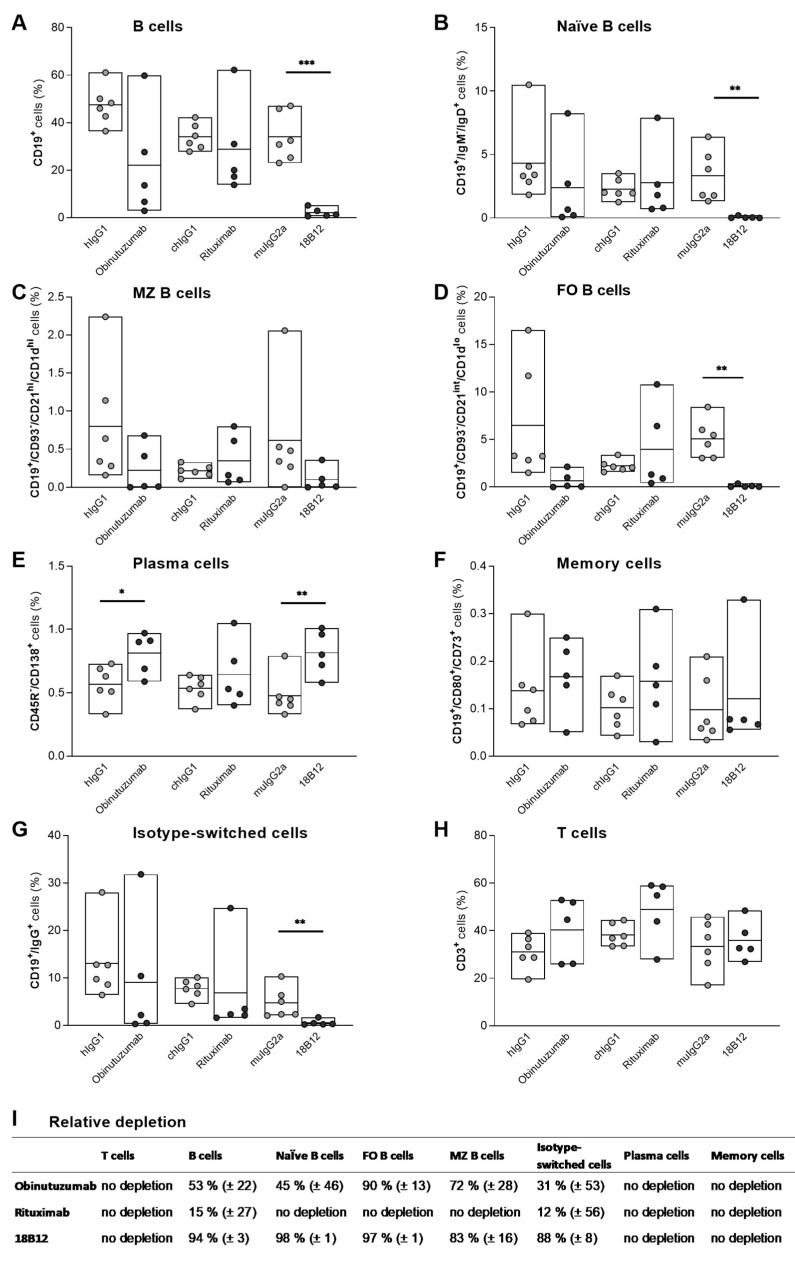
Figure 3.
Depletion of splenic B cell subsets by anti-CD20 mAbs in hCD20xhIgR3 and WT B6 mice. Spleen cells were harvested from 5 to 6 animals per group, 7 days after injection with 5 mg/kg of obinutuzumab, rituximab, 18B12, or the corresponding isotype controls. Using flow cytometry, cells were gated on single live lymphocytes followed by the identification of different B cell subsets using five separate antibody panels. Percentages were calculated in reference to the total lymphocyte population. (A) B cells were defined as CD19+, (B) naïve B cells as CD19+/IgM−/IgD+, (C) marginal zone B cells as CD19+/CD93−/CD21hi/CD1dhi, (D) follicular B cells as CD19+/CD93−/CD21int/CD1dlo, (E) plasma cells as CD45R−/CD138+, (F) memory cells as CD19+/CD80+/CD73+, and (G) isotype-switched cells as CD19+/IgG+. (H) T cells were defined as CD3+. Each circle represents the mean value of an individual mouse. The bars indicate the group mean value as well as minimum and maximum values. The following statistical tests were used for group comparisons: panels (A,D), Welch’s t-test; panels (B,G), Mann–Whitney U test; panel (C), unpaired t-test (OBZ), Welch’s t-test (RTX) and Mann–Whitney U test (18B12); panels (E,F), unpaired t-test; panel (H), unpaired t-test (OBZ); Welch’s t-test (RTX) and unpaired t-test (18B12). * p ≤ 0.05, ** p ≤ 0.01, *** p ≤ 0.001. (I) Relative depletion (mean ± SEM) of the different B cell subsets in anti-CD20 mAb- compared to isotype control-treated groups. FO, follicular; MZ, marginal zone.

