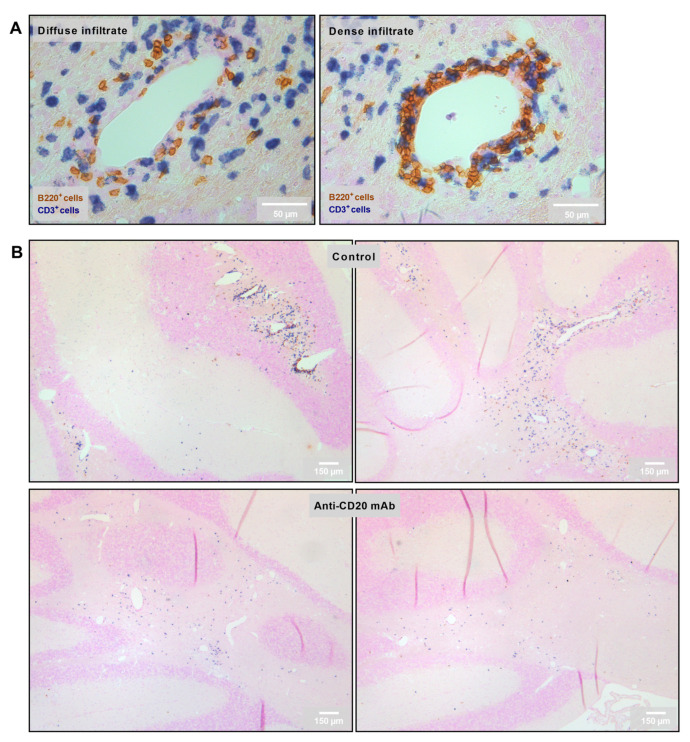
Figure 4.
Representative images of CNS infiltration in isotype control- and anti-CD20 mAb-treated groups: (A) Categorization of infiltrates depending on the diffuse vs. dense infiltration of lymphocytes into the CNS. B220+ cells were defined as B cells, and CD3+ cells as T cells. (B) Representative images of cerebellar infiltration in isotype control- (upper row) vs. anti-CD20 mAb (lower row)-treated groups.

