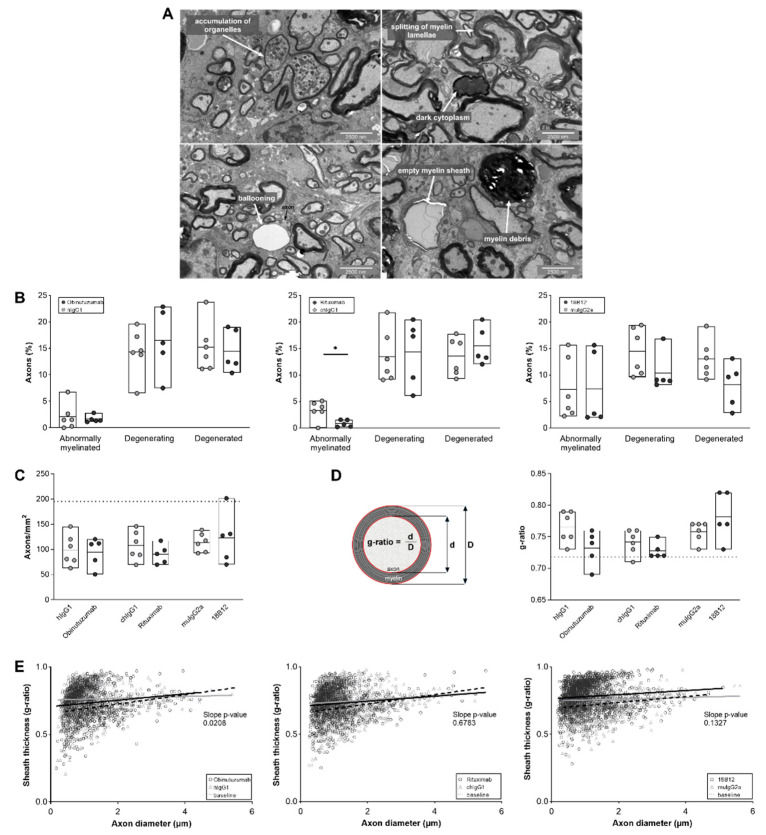
Figure 6.
Anti-CD20 mAb treatment effects on ultrastructural spinal cord pathology in hCD20xhIgR3 and WT B6 mice. Spinal cords of mice (n = 5–6 per group) were dissected 7 days after the final injection of 5 mg/kg anti-CD20 mAbs or corresponding isotype control. (A) Representative electron micrographs showing the different categories of nerve fiber degeneration. Splitting and ballooning of myelin lamellae indicate abnormally myelinated axons; accumulation of organelles and dark cytoplasm indicate degenerating axons; and myelin debris and empty myelin sheaths indicate degenerated axons. (B) Quantification of axonal degeneration. Each circle represents the mean value of an individual mouse. The bars indicate the group mean value as well as minimum and maximum values. The following statistical tests were used for group comparisons: abnormal axons, unpaired t-test (OBZ) and Welch’s t-test (RTX, 18B12); degenerating and degenerated axons, Welch’s t-test (all groups). * p ≤ 0.05. (C) Number of axons per mm2. The dotted line marks the baseline value (195 axons/mm2) in healthy mice (n = 7). Statistical significance was evaluated by unpaired t-test. (D) The g-ratio was calculated by dividing the diameter of the axon by the diameter of the nerve fiber (axon + myelin sheath) in a mean ± SD of 229 ± 37 randomly selected axons/mouse (n = 5–6 mice per group). The dotted line represents the baseline value of normally myelinated axons (0.718) (n = 7; mean ± SD of 13 ± 19 axons/mouse). The bars indicate the group mean value as well as minimum and maximum values. Statistical significance was calculated using unpaired t-test. (E) Scatter plots showing the myelin sheath thickness of individual myelinated axons as a function of the respective axon diameter with simple linear regression analysis (black line: anti-CD20 mAbs; grey line: isotype controls; dashed line: baseline). The baseline was determined from healthy mice (n = 7). The significant slope change in the regression analysis of obinutuzumab-treated mice toward the baseline indicates a positive effect of the therapeutic mAb on myelination (p = 0.0298). Statistical significance was calculated using ANCOVA.

