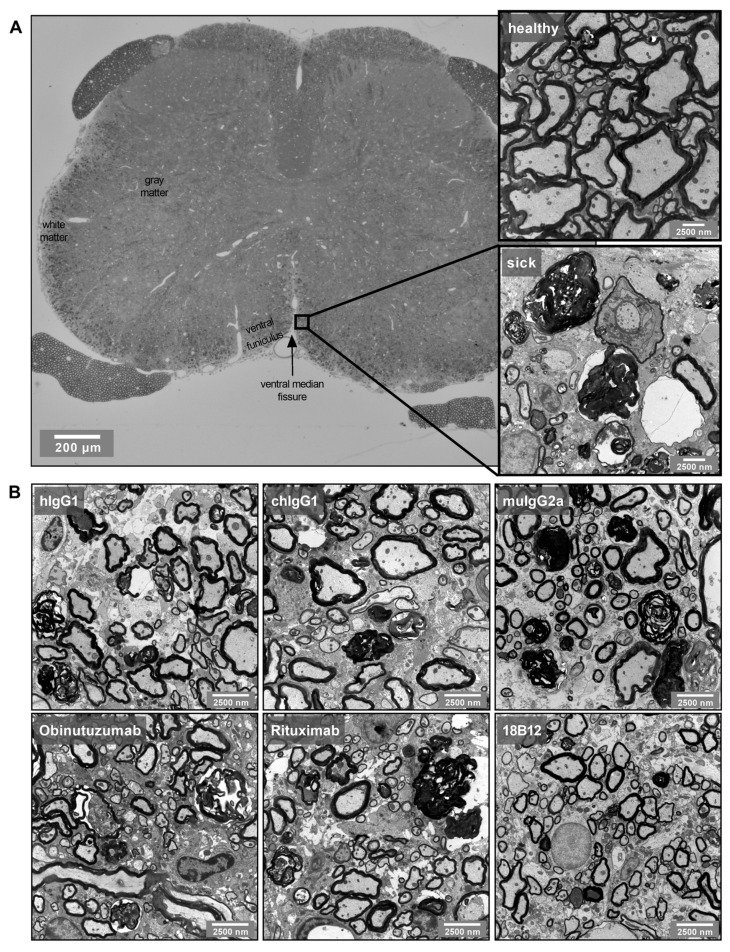
Figure 7.
Representative spinal cord EM images: (A) EM images were taken from the ventral funiculus of transverse spinal cord sections. The magnifications show the difference between healthy and EAE (sick) tissue. (B) Representative EM images from the different isotype control- and anti-CD20 mAb-treated groups.

