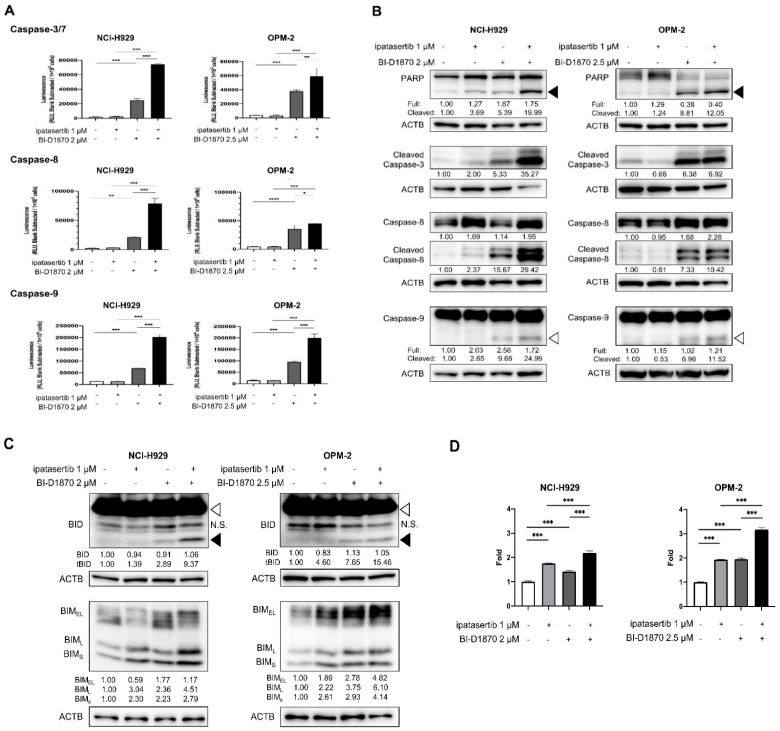
Figure 3.
Molecular effects with apoptotic induction by BI-D1870, ipatasertib, and their combination: Cells were seeded at 2 × 10⁵ cells/mL and treated with indicated concentrations of BI-D1870, ipatasertib, or both agents for 48 h. (A) Activities of Caspase-3/7, Caspase-8, and Caspase-9 of untreated and treated cells measured by Caspase-Glo assay systems. (B) WB analyses for the detection of processing of caspases and PARP. Black arrow head and white arrow head indicate cleaved form of PARP and cleaved form of Caspase-9, respectively. (C) WB analysis for the detection of the activation of BID and the induction of BIM in untreated and treated HMCLs. White arrow head and black arrow head indicate full length BID and truncated BID, respectively. N.S.; no specific band. Expression levels relative to control (untreated cells) are shown below each band measured by densitometric analysis using Image-J software. ACTB was used as an internal control. (D) Transcriptional levels of BIM in treated cells relative to untreated cells. Mean value with S.D. of triplicate data. * p < 0.05, ** p < 0.01 *** p < 0.001, **** p < 0.0001.

