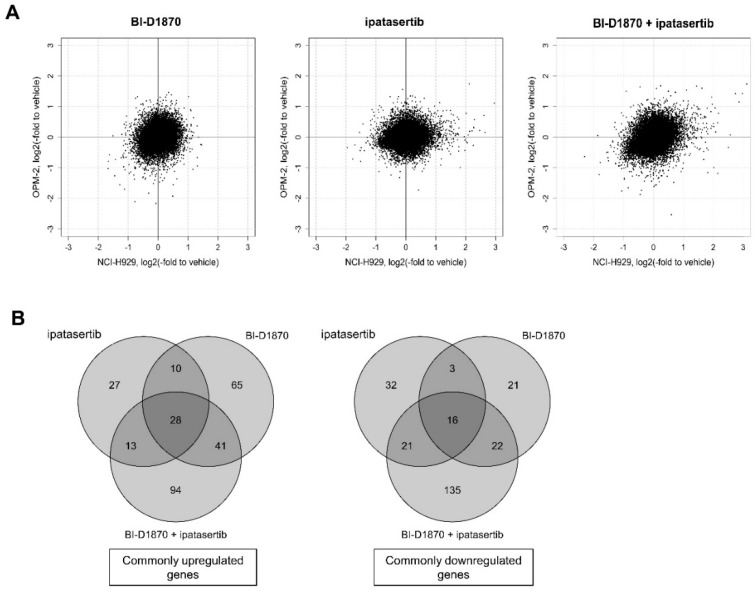
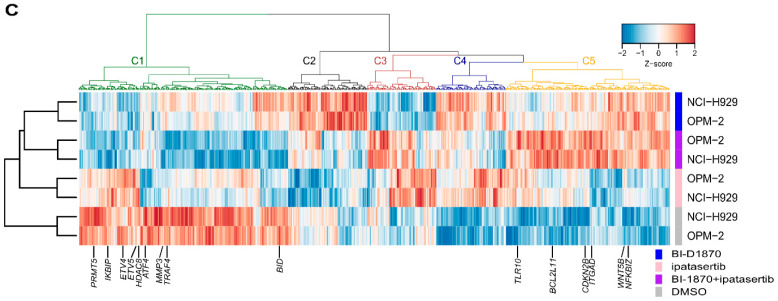
Figure 4.
Gene expression change induced by BI-D1870, ipatasertib, or their combination in HMCLs: (A) Expression changes in all investigated genes relative to vehicle cells in NCI-H929 (X-axis) and OPM-2 cells (Y-axis). (B) Venn diagrams for numbers of commonly significantly upregulated (left) and downregulated (right) genes in NCI-H929 and OPM-2 cells. (C) Clustering of significantly modulated genes after treatment in NCI-H929 and OPM-2 cells.


