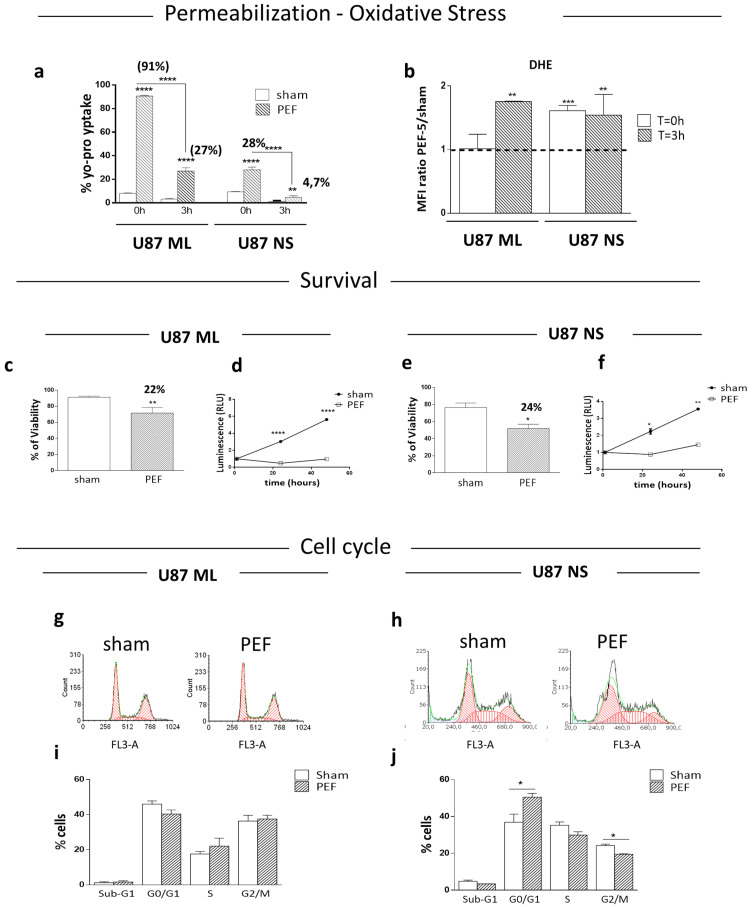
Figure 2.
Membrane permeabilization, ROS production, cell survival and cell cycle. (a) Yo-pro-1 uptake at T = 0 h and at T = 3 h after PEF-5 exposure in U87 ML and U87 NS cells. (b) ROS levels after PEF-5 exposure at T = 0 h and T = 3 h. The histogram shows the ratio between the mean fluorescence intensity (MFI) of exposed and sham-exposed cells in both cell culture conditions. (c–e) Bar graphs of sham-exposed and exposed U87 ML and NS cells 24 h after PEF-5 exposure for cell death quantification (Trypan blue assay). (d–f) Cell proliferation evaluated at different time points (0, 24 and 48 h) after PEF-5 exposure in U87 ML and U87 NS. (g–j) Cell cycle phases in U87 ML and NS at 24 h after PEF-5 exposure. p values were determined using a two-tailed t test. * p < 0.05; ** p < 0.01; *** p < 0.001; **** p < 0.0001.

