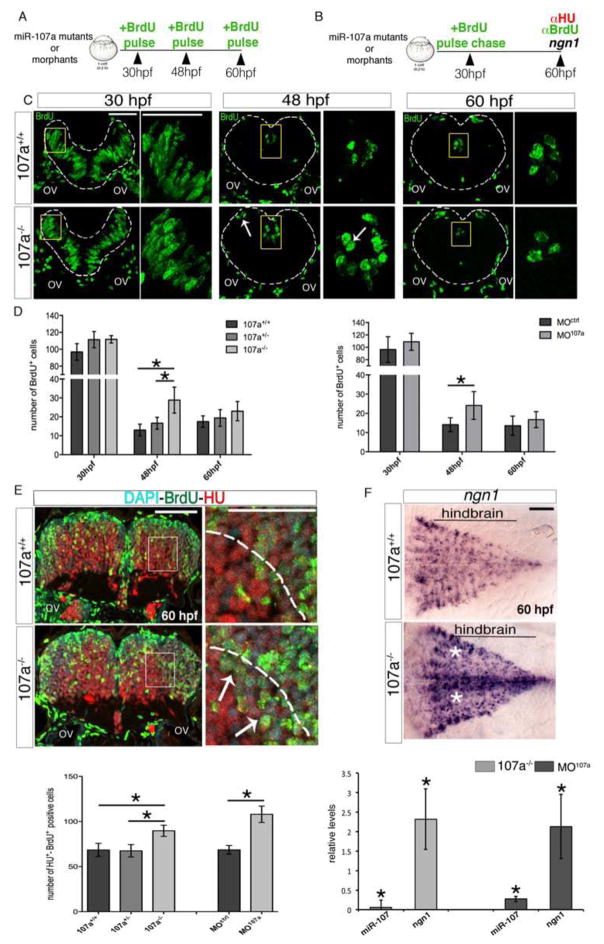
Figure 4. Loss of miR-107 function promotes embryonic hindbrain neurogenesis.
(A and B) Schematic representation of the experiments in (C–D) and (E), respectively. (C) Hindbrain cross-sections showing brief BrdU pulse labeling of miR-107a+/+ and miR-107a−/−mutants at 30, 48 and 60 hpf. Panels in the right are high magnifications of the area boxed in the left panels. White arrows indicate supernumerary BrdU+ cells. Gray dashed line indicates the hindbrain area. (D) Number of BrdU+ cells per section in (C) and in the MO107a and MOctrl injected embryos treated in the same conditions. Data are shown as mean ± SEM of two independent experiments for 107a mutants and three for the morphants (n= 5 to 10 embryos each). *p<0.05. (E) Top panel shows hindbrain cross-sections of 60 hpf miR-107a+/+ and miR-107a−/− mutants stained for BrdU and HU. Panels in the right are high magnifications of the boxed area in the left panels. Arrows indicate the increase of BrdU-HU double-positive cells migrating in the mantle area (dashed line). The graph at the bottom shows the quantification of the number of BrdU-HU double positive cells in the indicated samples. Data are shown as mean ± SEM of two independent experiments for 107a mutants and three for morpholino (n= 5 to 10 embryos each). *p<0.05. (F) Expression of ngn1 in 107a+/+ and 107a−/− mutants at 60hpf. Dorsal is up, anterior is to the left. White stars indicate increased ngn1 staining. The graph shows the quantification by qRT-PCR of miR-107 and ngn1 expression levels in 107a mutants and in MO107a injected embryos. Levels are relative to the respective controls (107a−/− and MOctrl respectively). Data are shown as mean ± SEM. *p<0.05. Scale bars= 50μm

