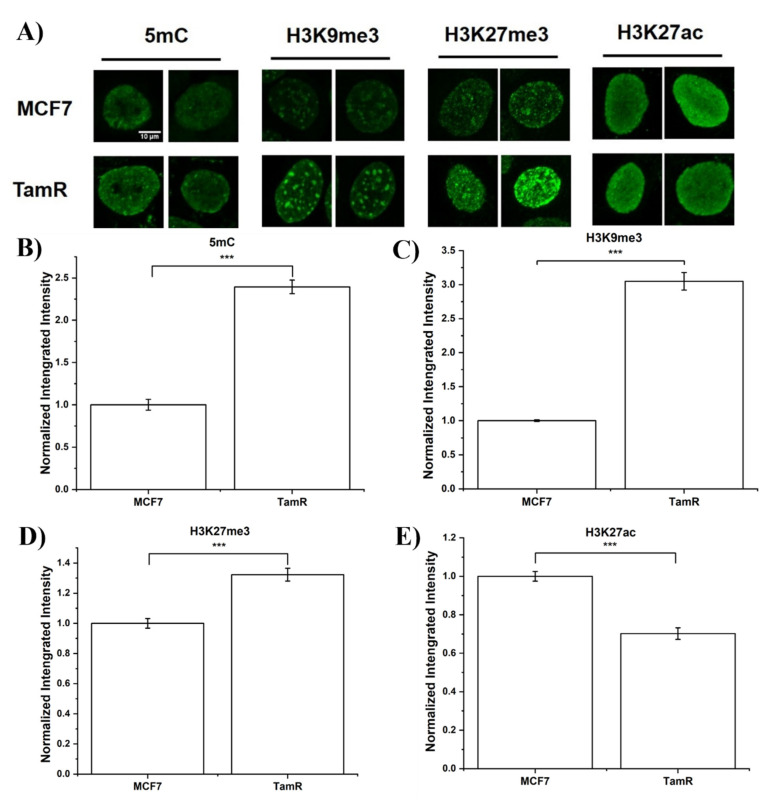
Figure 1.
(A) Representative images of MCF7 and TamR cells stained with 5mC, H3K9me3, H3K27me3, and H3K27Ac antibodies. Scale bar = 10 µm. (B–E) Bar plot of nuclei integrated intensity of the two cell lines (MCF7 and TamR) stained with marker (B) 5mC, (C) H3K9me3, (D) H3K27me3, and (E) H3K27Ac. Error bar represents standard error. N > 100 cells in each group. *** indicates statistical difference with p < 0.001 calculated by a one-way ANOVA analysis followed by Tukey’s post-hoc test.

