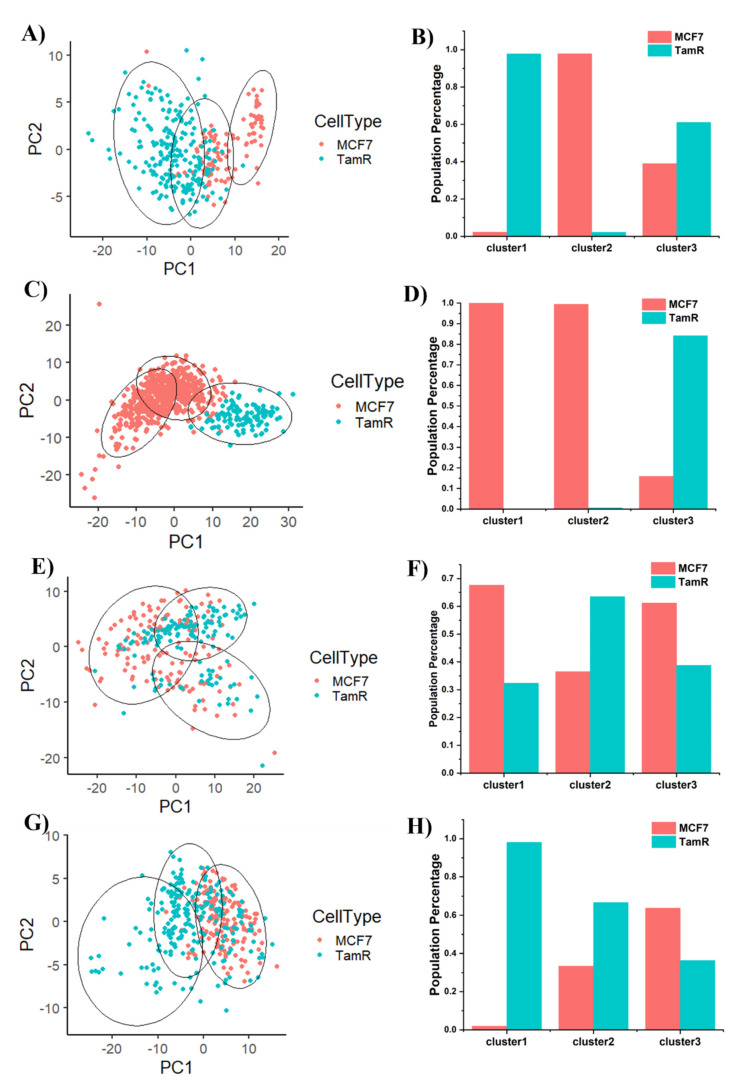
Figure 2.
Principle component analysis (PCA) of MCF7 and TamR cells stained with (A) 5mC, (C) H3K9me3, (E) H3K27me3, and (G) H3K27ac. Circles represent k-means clustering results. Percentage of MCF7 and TamR cells in each cluster are calculated and plotted in (B) 5mC, (D) H3K9me3, (F) H3K27me3, and (H) H3K27ac.

