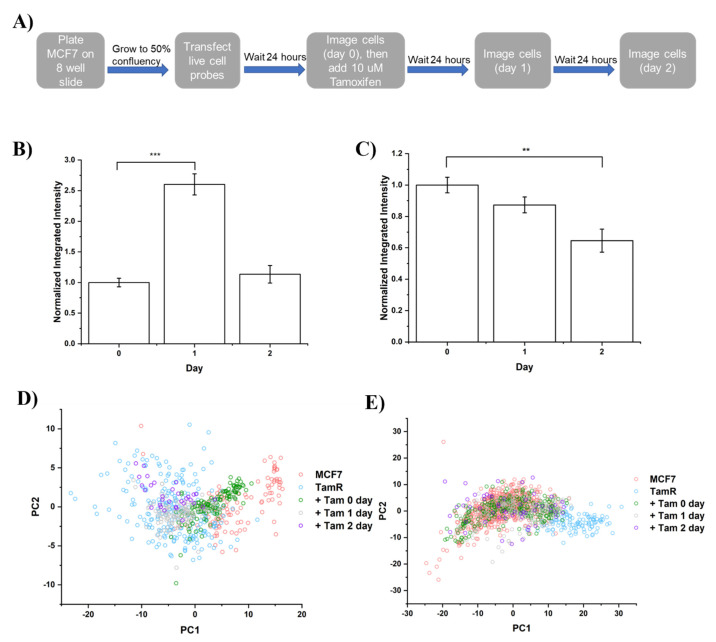
Figure 3.
(A) Schematic illustration of live cell tracking imaging and treatment timeline. (B,C) Barplot of normalized integrated intensity of single cells transfected with (B) dMBD1 probe targeting meCpG and (C) H3K9me3 probes. Normalization was performed by dividing the intensity of the TAM treated group by the intensity of the non-treated group. (N > 50 cells. **: p < 0.01; ***: p < 0.001 (one-way ANOVA followed by Tukey’s post-hoc test). (D,E) PCA of MCF7 cells transfected with a (D) meCpG probe or (E) H3K9me3 probe mapped to PC space constructed from 5mC or H3K9me3 immunostaining.

