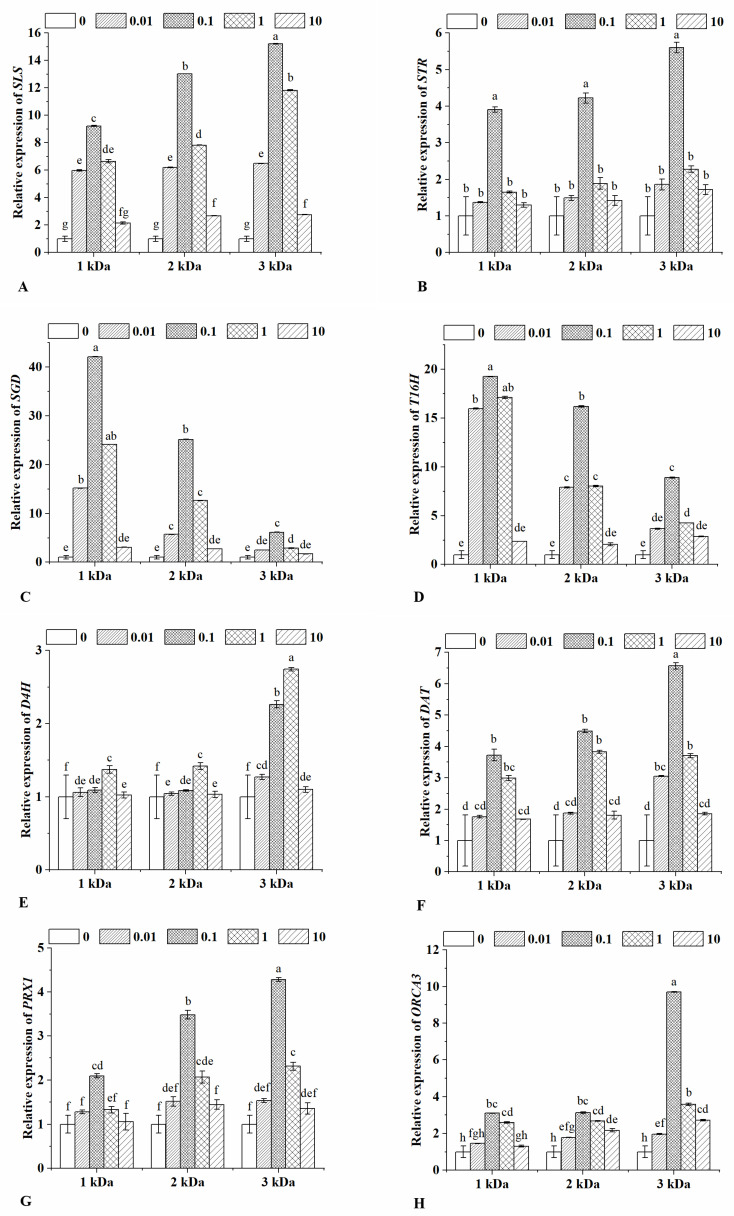
Figure 3.
Relative expression of SLS (A), STR (B), SGD (C), T16H (D), D4H (E), DAT (F), PRX1 (G) and ORCA3 (H) in the leaves of Catharanthus roseus under different chitooligosaccharides treatments. The treatments were conducted with chitooligosaccharides of three molecular weights (1, 2 and 3 kDa) at four different concentrations (0.01, 0.1, 1 and 10 μg/mL). Vertical bars represent the standard deviation of three replicates. Different letters indicate statistically significant difference at p < 0.05.

