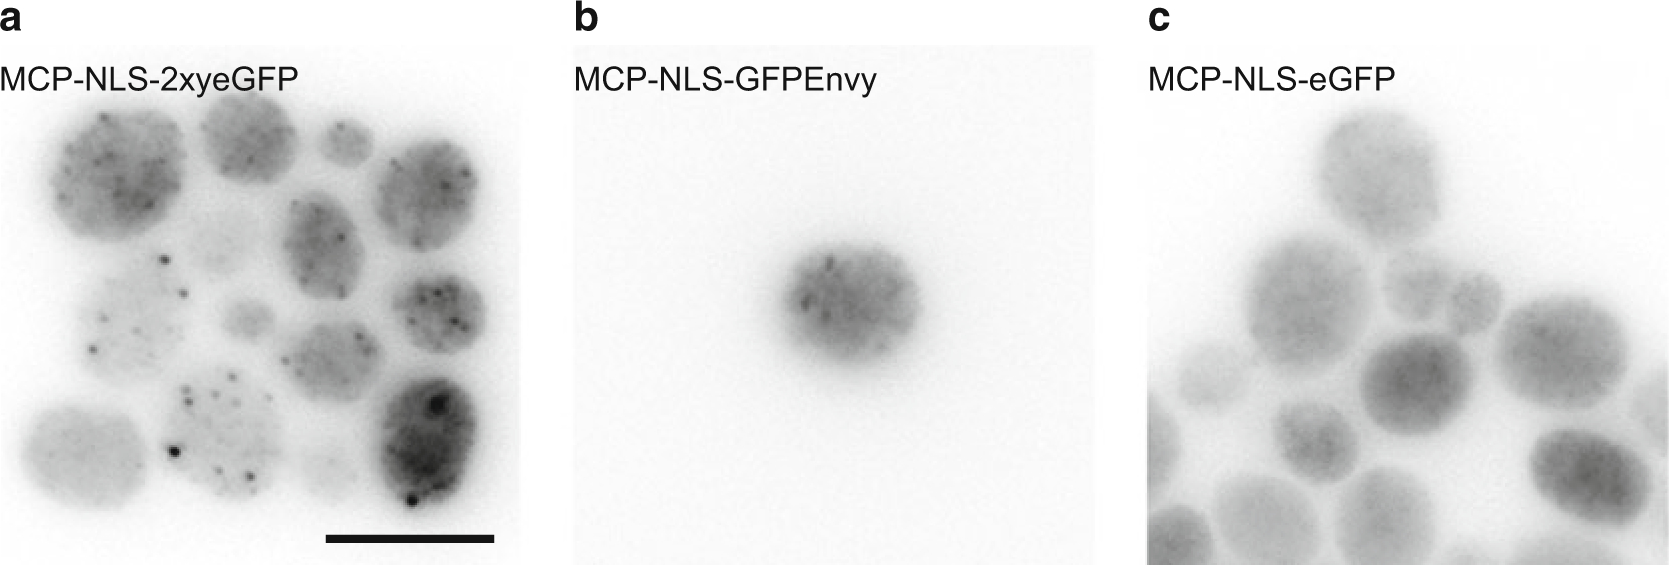
Fig. 2.

Comparison of MCP-FP variants in yeast. Images are from yeast cells expressing the DOA1 gene tagged with 24×MBSV6 transformed with (a) MCP-NLS-2xyeGFP plasmid, (b) MCP-NLS-GFPEnvy plasmid, (c) MCP-NLS-eGFP plasmid. Panels are maximum intensity projections of Z-stacks. Scale bar 5 μm
