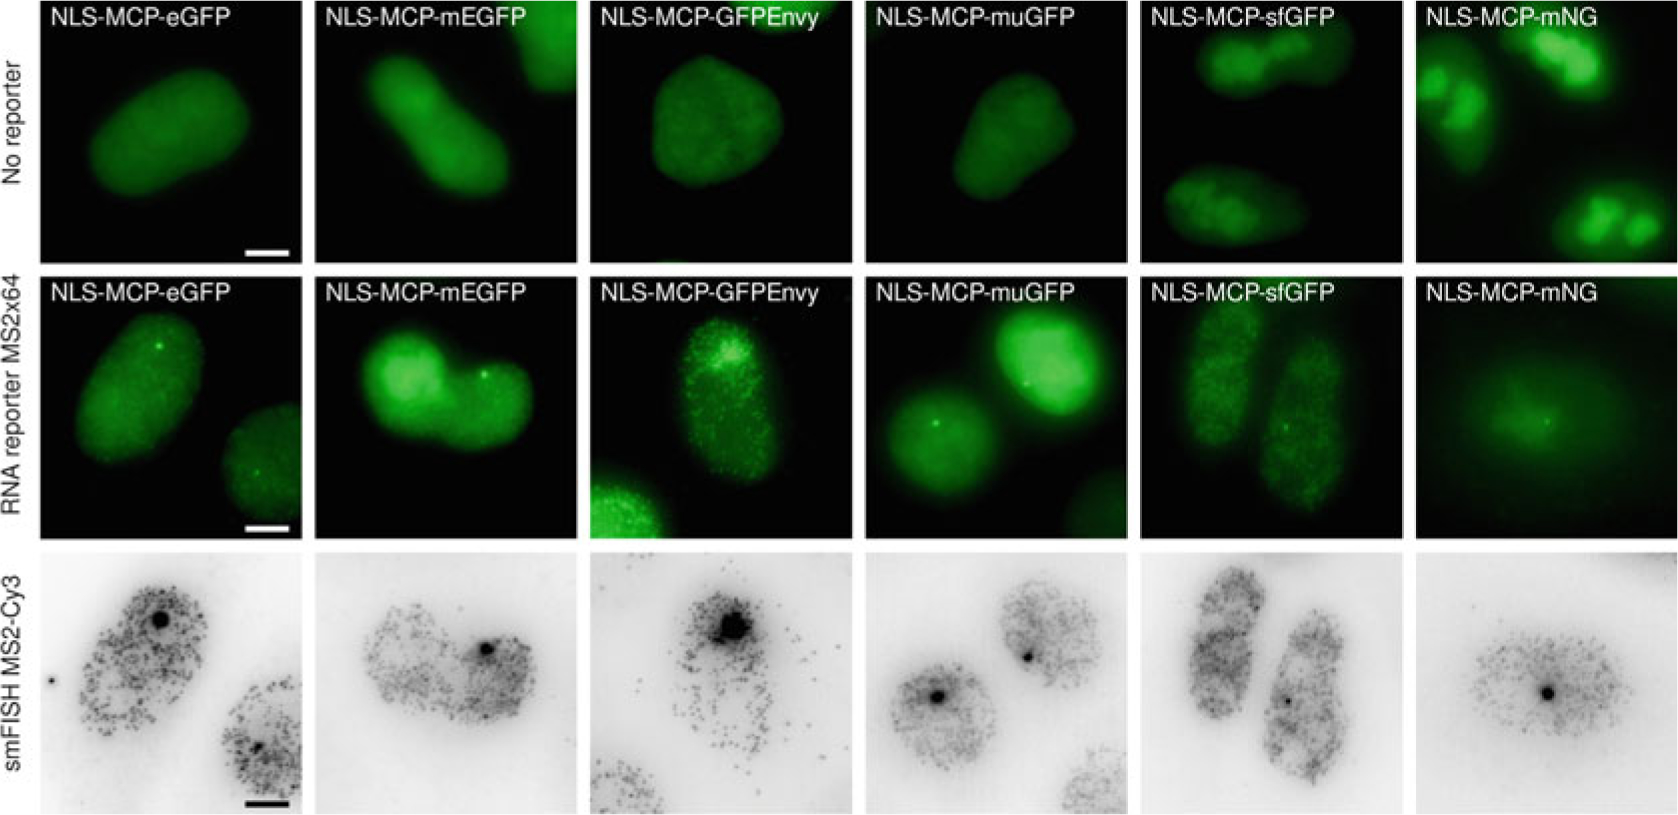
Fig. 3.

Comparison of MCP-FP variants in mammalian cells. Images are maximum intensity projections from HeLa Flp-in cells transfected with the indicated NLS-MCP-FP variant constructs. Top panels: Images are from cells expressing the indicated NLS-MCP-FP variants without RNA reporter (parental HeLa H9 AAVS1-Tat cell line). Middle panels: Images are from cells expressing the indicated NLS-MCP-FP variant in HeLa H9 AAVS1-Tat cell line expressing the HIV-1 MS2×64 reporter. Bottom panels: Images are smFISH signals obtained with probes against the MS2 tag. Scale bar 5 μm. Contrast adjustment is identical for all images of the top and middle panels
