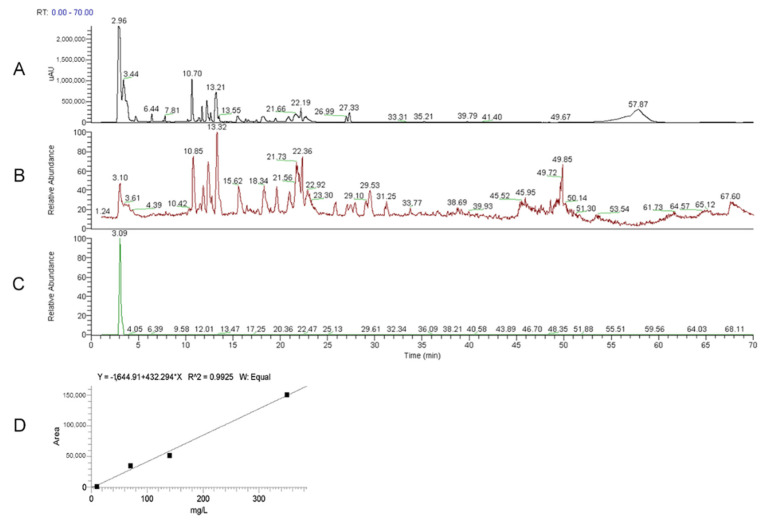
Figure 2.
HPLC-UV-ESI/MS was used to quantify the ERGO amount in He2 extract. (A) UV (Ultra Violet) trace of He2 primordium. (B) ESI full MS (mass spectrum) trace of He2 primordium. (C) Standard molecule of L-(+)-ERGO: mass spectrum (MS)/MS Selected Reaction Monitoring m/z 230 > m/z 186 trace. (D) Calibration curves for ERGO.

